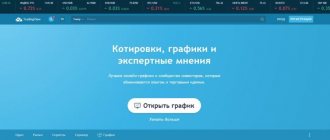
Today, for trading on the Forex market, brokerage companies offer the most modern terminals with advanced functionality for technical analysis. However, even, for example, the well-known MetaTrader terminal does not always make it easy to implement the most daring analytical ideas, so for many, the TradingView live chart service becomes an excellent alternative. Let's look at how this platform will be useful for a Forex trader.
So, Tradingview.com is one of the popular web platforms for technical analysis (read what it is at the link), as well as a social network for entrepreneurs from all over the world. The platform works in a browser version, that is, it does not need to be downloaded to a PC, and the graphics do not slow down, since the HTML5 web standard ensures high speed and smooth operation.
| Demo account | Try it for free! | |
| Free account in Tradingview | To the website | |
Of course, at first glance, this service duplicates all the functionality of the MetaTrader terminal - here you can also select different types of display and time frames for the chart, install indicators and use various graphical tools, scroll and scale the chart, etc.
However, the trick is in having unique tools:
- additional types of charts - more than 10 display options, including exotic renko, kagi, tic-tac-toe (charts are also available in the mobile version of the site)
- alternative alerts – 13 price behavior options and the ability to receive alerts via SMS and email
- functionality for arithmetic operations with trading instruments (creation of synthetic spread charts)
- tools for creating your own strategies in the Pine editor
- additional graphical tools (Fibonacci spiral, Fibo circles, Wedge, Gann tools)
- availability of additional graphic patterns
- ability to compare indicators in one window
- tester to determine the effectiveness of strategies
- availability of a service for trading ideas, where you can share not only your own forecasts, but also use the ideas of other traders for trading
In fact, this service is an excellent option for traders who prefer wave and graphical analysis for market analysis - for this, TradingView is equipped with many templates that are very easy to use in practice.
But there is a certain nuance in using this resource - most of the unique tools are available only on the paid version. At the same time, 3 packages are offered - PRO, PRO+, PREMIUM.
For example, the Line Breakdown, Renko, Kagi, and Tic-Tac-Toe chart types can be used on intraday intervals only by holders of PRO+ and PREMIUM accounts. You will need to purchase PRO accounts and, if you wish, use spread charts on intraday timeframes, volume indicators and off-session trading information.
Also, on PRO accounts, unlike the free version, the following is available:
- setting timeframes for asset charts – you can set absolutely any interval
- use of up to 8 charts on one analytical space
- no advertising
- function for calculating an indicator using another technical tool - allows you to apply indicators to each other with one click (only one option for indicators applied to each other is available for free users)
- ability to save an unlimited number of charts (on the free version you can save only 5 charts)
- the ability to simultaneously use an unlimited number of indicators (on the free version - no more than 10)
That is, when using it for free, you will be limited primarily to only some functions for intraday analysis and additional opportunities for deeper market analysis. However, you will have access to all the standard functions of the platform - over 50 graphical functions, the entire set of underlying assets, a stock screener, a huge database of indicators, demo trading, instrument comparison, functional price scales and absolutely all the standard options.
What is TradingView? Overview of the platform for traders
TradingView (TradingView, official website in Russian https://ru.tradingview.com) is both a social network for traders around the world (audience of more than 15 million users per month) and a platform for technical analysis of various assets (currency, stocks, cryptocurrency , bonds, indices, futures). The service has been operating since September 2011, the company's offices are located in New York in the USA, in Moscow, Rostov-on-Don and St. Petersburg in the Russian Federation.
Today, TradingView is primarily a social network in which the world's best traders share their trading ideas, ready-made scripts and indicators for trading. TradingView charts are considered one of the best among traders and are recognized by many trading platforms and services (for example, integrated into the largest cryptocurrency exchanges: Binance, KuCoin, EXMO, etc.).
Among the key advantages of the TradingView platform, we note: the presence of a Russian-language version of the site, many tools for technical analysis, “live” charts for a wide variety of trading pairs, fast operation of the platform, the availability of hundreds of thousands of ready-made trading ideas, trading strategies, etc.
About the developer
TradingView was founded in 2011 by Denis Globa (CEO), Stan Bokov (COO) and Konstantin Ivanov (CTO). Together with Andrey Kirillov (CFO), they form the TradingView executive team. TradingView is headquartered in New York, and the company also has development offices in Rostov, St. Petersburg and Moscow. The head office for the European market is located in London.
Company: TradingView
Developer website: https://ru.tradingview.com
Friends, if you work with Tradingview analytics, please leave feedback about the service in the comments. With this simple action, you will help your colleagues use high-quality analytics for trading.
TradingView - reviews of trading analytics admin
Registering an account in TradingView
Registration on TradingView is quite simple and takes only a few minutes, for this:
- Go to the official website of the platform: https://ru.tradingview.com
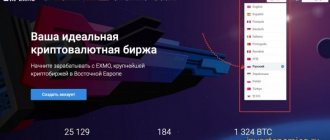
- If it is not activated immediately, select the Russian language in the menu.
- In the menu on the right, select “30 days free”.
- On the page with a list of tariffs, select the appropriate one (for example: PRO or Basic - free tariff).
- In the registration pop-up window, select registration via your Facebook, Google+, Linkedin, Twitter or Email profile.
- We complete registration and enter your personal account.
Bonus from the Probivnoy.com blog: upon registration: for registering using the link from this review, all new users receive 3000 coins (or 30 USD) to their TradingView account to purchase a paid subscription.
Paid subscriptions to TradingView and Premium account options
There are 4 tariff plans (subscriptions) available for registered users on TradingView, each of which has its own set of advantages, as well as different prices (payment is possible per month and per year):
- Basic. Free subscription available immediately after registration
- PRO. Cost: for 1 month = 14.95 USD, for 1 year = 155 USD.
- PRO+. Cost: for 1 month = 29.95 USD, for 1 year = 299 USD.
- Premium. Cost: for 1 month = 59.95 USD, for 1 year = 599 USD.
Note: it is more profitable to sign up for a paid subscription for 1 year at once in order to save 16% (as opposed to a monthly renewal). Important benefits of a paid subscription include no advertising, the ability to use more indicators on one chart, cloud alerts, more charts in one tab, and much more.
You can pay for your subscription with a bank card or PayPal account, and you can test each type of subscription for free for 30 days (you need to select “Free for 30 days” in subscriptions).
Tradingview Strategies
Using the Tradingview service is intuitive, so there will be no problems finding the necessary options and using them. We recommend that you register immediately, even if you do not plan to buy a PRO account - this way you will get rid of annoying reminders from the service about registration and will be able to fully use all the functionality of the free version. If you decide to give yourself access to all the tools, the service offers 30 days of free testing of PROplus options.
So, let's look at several functions that are useful in market analysis.
As an effective tool for technical analysis, you can use graphical tools, for example, the Fibonacci spiral (more about Fibonacci tools).
The starting point for constructing a spiral is the turning point of the trend movement and the next trend maximum or minimum, and a new turn of the spiral will indicate the completion of the current trend:
In terms of graphical analysis, you can also use a set of Gann tools, which work great for identifying market trends.
TradingView also allows you to correlate between different charts in one window. That is, you do not need to visually compare quotes in two windows - the movement in the value of both assets will be displayed on the same chart. As an example, consider the correlation between the EUR/USD and USD/JPY currency pairs:
As you can see, the value of the euro is decreasing relative to the value of the American dollar, while the value of the USD is growing relative to the Japanese yen. However, we do not recommend using more than two assets in one window - this will only confuse the determination of the pattern of price behavior of trading instruments.
One of the effective tools of the TradingView service is the ability to build synthetic spread charts, which allow you to see a clear picture of the market situation using mathematical operations (available on intraday intervals only on PRO+ and PREMIUM). This service allows you to combine two charts on one field, divide them, raise them to a power and subtract them from each other, that is, everything that cannot be done in any of the terminals for Forex trading of brokerage companies.
For example, in order to see the current situation on the Oil market regarding the growth or decline of its value in rubles, you need to create a Brent/Rub chart using the USD/RUB and Brent instruments that correlate with each other. To do this, you need to enter a simple formula BRENT / USDRUB in the search bar of the trading instrument:
After this, you can use several approaches to trading:
- pair trading, using the difference between the cost of trading instruments, taking into account the fact that on the Brent/Rub chart the value of the asset will be displayed as an average value
- as an addition to the trading strategy - for example, if it is impossible to clearly predict the future movement of quotes on the USD/RUB chart, then the BRENT/RUB chart will allow you to see the level of oil prices in rubles
In this case, you should build spread charts only on assets that correlate with each other, since mathematical operations between spontaneously selected trading instruments will not be informative. Of course, spread charts are an amateur tool that not every trader uses. However, sometimes it is a synthetic chart that allows you to look at the market situation “with different eyes.”
Another useful service is additional indicators that are not available on MetaTrader and ready-made templates for indicator strategies. Trading strategies are paid, but each of them can be tested. It is worth noting that TradingView is not equipped with a classic trading system tester, which is offered in MetaTrader - in this regard, only functionality is available for evaluating methods using profitability and drawdown charts. Using the tester, you can also analyze your own systems created in the specialized Pine editor. That is, you only need to project a tactic onto the chart of the selected asset and its effectiveness will be displayed in the “Strategy Tester” tab.
Another interesting feature of this service is that you can use trading ideas from other traders, and you can also share your own experiences to hear the opinions of other portal participants:
In general, Tradingview.com live charts can really be used as a useful support service for technical analysis - an expanded set of technical indicators, a huge number of underlying assets and graphical tools will allow you to make both long-term and short-term forecasts for asset markets, assess the current situation and simply get new ideas for profitable trading.
Of course, not all exclusive services of this analytical platform are available in the free user package, so those who want to use all the features will have to fork out for a PRO account.
How to use the TradingView platform? Overview of the menu and service capabilities
It’s best to start getting acquainted with the official TradingView website from the main menu of the platform, which includes the following sections:
- Schedule. The main feature of the platform is a chart for various financial assets with real-time price changes and many settings and indicators for technical analysis of the selected trading pair.
- Trade. Section with a list of brokers that, according to the Trading View portal, are the best at the moment.
- Markets. Online quotes for stocks, currencies, cryptocurrencies, indices, futures and bonds.
- Screeners. Forex, stock and cryptocurrency market screeners (tables with important data on many trading pairs and recommendations for buying or selling).
- Ideas. A section of ready-made ideas for various financial markets regularly updated by platform traders (you can find promising trading ideas, share your opinion with the author of the idea and other traders).
- Broadcasts. List of webinars for investors and traders of the platform.
- Scripts. TradingView public library with many indicators and strategies written in the Pine programming language.
- More (Reference, for business, etc.).
After the first familiarization with the main sections of the TradingView platform, it will be easier and clearer to work with the platform in the future, understand whether you need a paid subscription and how this platform will be useful for your trading.
Widgets
Let's look at three of the most popular widgets from Tradingview and show how they work on our website.
Schedule
The advanced graph widget is a powerful, free tool that makes it easy to embed a graph into any website.
Chart L courtesy of TradingView
Cross rates
With the Currency Cross Rates widget, it will be possible to display real-time quotes for selected currencies in comparison with other major currency pairs.
Exchange rates provided by TradingView
Economic calendar
The Economic Calendar widget shows important future economic events and news.
Economic calendar from TradingView
TradingView for business
The TradingView platform offers many useful features and solutions, not only for traders and ordinary users, but also for website owners, exchanges and brokers:
- TradingView Widgets. The easiest and fastest way to add financial charts to websites.
- TradingView charts for websites. The ability to add any charts from TradingView to your website or Internet service for the convenience of your users.
- Broker integration. Integration of broker services into the TradingView platform via API.
- Advertising. Possibility of ordering native advertising among a high-quality solvent audience of traders.
Using ready-made business solutions from TradingView, you can significantly increase the loyalty of the audience of your financial sites and services.
TradingView App for PC and Mobile Phones
The platform and charts from TradingView are convenient to use not only in the Web version of the site, but you can also use official applications:
- For PC (Windows, macOS, Linux).
- For mobile phones and tablets (iOS, Android).
Advice from Probivnoy.com: it is recommended to download the TradingView application only through the official website (links are located in the footer, at the very bottom of the main page).
Main advantages and disadvantages of the TradingView service
pros
- TradingView is the choice of many traders due to the high quality of the platform and its reliable reputation (developed over 10 years).
- You can view and publish your trading ideas while communicating with other traders from different countries.
- A wide selection of indicators and technical analysis tools are available on each chart.
- The platform is free to use (but with some restrictions).
- Traders have access to a regularly updated section of economic news, market forecasts, various statistics and calendars of reports from the world's largest companies.
- There are screeners for stocks and other assets.
- Lots of tools for brokers and website owners (widgets, embedded charts, etc.).
- All users have access to referral and affiliate programs for additional earnings (under the referral program, you can earn 3,000 coins (30 USD) for purchasing a subscription by a new invited user, and under the affiliate program, you can receive 30% of the cost of the subscription purchased by partners).
Minuses
- The free plan is quite limited.
- At first, it will be difficult for beginners to understand the rules of the platform, especially in technical analysis using charts and correct construction.
Final Conclusion and Feedback on TradingView.com
Over many years of operation, the platform for traders TradingView has become one of the world leaders in this field, which is confirmed by the presence of prestigious world awards, as well as the use of this platform by the largest financial portals, brokers and crypto exchanges. This platform is also popular among ordinary traders, especially more experienced ones, as it provides access to a wealth of functionality and important financial news, indicators and ideas necessary for productive and profitable trading in financial markets.
Many traders often search for the official TradingView website using the following queries: Trading View, Trading View, Trading View, Trading View, Trading View, Trading View, Trading View, etc.
If you have experience using this trading platform, or have questions about its operation, please leave your feedback about TradingView in the comments below under this review.
Probivnoy Team
The material was prepared by the Probivnoy.com blog team. We write reviews, instructions, research and review articles about cryptocurrency, blockchain technology, cryptocurrency exchanges, payment systems and electronic wallets, investments and making money on the Internet.
Similar articles on the topic:
- Binomo (Binomo) – registration, review of the official website and reviews of the Binomo.com trading platform
- Pocket Option - registration, review and reviews of the binary options broker PocketOption.com
- Coinlist (Coinlist) - registration, verification, review of the official website in Russian and reviews of the exchange
- INTRADE.BAR (Intrade Bar) - registration, review, earnings and real reviews about the broker...
- Broker Quotex (Quotex) - registration, review and reviews of the Quotex.com trading platform
- Bountyhive io (BountyHive) - review, registration and reviews
Functionality
Analytics quality
Useful in trading
Great widgets
Comment: Excellent service with interactive charts of currencies, stocks, futures, etc. Tradingview is one of the most popular analytics projects in the world of finance
4.3
Your reviewYour review
: 1.6 (1 votes)
Reviews: TradingView - reviews of trading analytics
- Maxim Krivorotov, left a review
08/22/2020 at 09:29I used a paid subscription to TradingView for several years, and recently I encountered the fact that one of the indicators does not display data correctly. At first I thought that something was wrong with me. I wrote to my friends who also use TradingView. And all four of us had completely different data! Everyone has! I wrote about this to support. In response, they began to be rude, saying that it was I who had messed up something. In short, I canceled their subscription and have no desire to contact them anymore.
reply to review
- Ilya, left a review
09/07/2020 at 13:59
I wrote to one adviser there that his investment idea was sh*t. So they banned me. Although I had a paid subscription for a year. No one plans to return my money.
reply to review
- Albert Kukharenko, left a review
02.10.2020 at 15:36
You don’t have many reviews here about tradingview. I'll add my 5 cents. In general, of course, the site is ok. A lot of analytics. Sometimes it even seems like too much. Everything is structured, but nothing is clear. I'm completely new to Forex and can't figure out what's what. I decided to buy paid access, I thought that there would be at least some more interesting conditions there. I don’t know if any content is more understandable. But no. I just wasted my money. I paid like a sucker for a year in advance. Now I don’t know how to figure this out. A very heavy, clumsy and incomprehensible site.
reply to review