A bear market is a stock market condition in which stock prices fall 20% or more from recent highs amid widespread pessimism and negative trading sentiment. As a rule, this trend is associated with a decline in the general market or index (for example, S&P 500, RTS or MICEX). However, this concept also applies to individual securities or commodities. They can be considered to be in a bearish trend if they experience a decline of 20% or more over an extended period of time—usually two months or more. At its core, this is a downward trend with falling quotes, when each subsequent minimum is lower than the previous one.
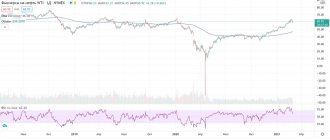
Major US market indices fell into bearish territory on December 24, 2022 (the S&P 500 fell 19.8%). The last prolonged bearish trend in Russia occurred between 2007 and 2009 during the global financial crisis and lasted approximately 17 months. During this time, the RTS decreased by 4 times.
What types of markets are there? Let's take a closer look.
Secular and cyclical
Bear markets can last several years or just a few weeks.
- Secular
- can last from 10 to 20 years and is characterized by below-average returns on a sustainable basis. During such periods, rallies can occur where a security or index rises for a period but the rise is not sustained and prices return to lower levels. - Cyclic
type - can last from several weeks to several years.
Key information
Bear markets are those in which stock prices fall by more than 20 percent amid widespread negative sentiment and investor concerns.
They can be cyclical or secular. The first lasts a few weeks or a couple of months, while the second can last for several decades.
Short selling, put options and inverse ETFs are some of the ways traders can make money during this period.
Rules for constructing a trend line
The use of a price trend is available to a trader only if he knows how to correctly draw a trend line. This is not difficult to do. It's all about practice and knowledge of the rules of such construction.
So, the trend line is drawn through significant extreme points. Lows are important for an upward trend. For the downward trend there are correspondingly highs.
There must be at least two such extrema. However, it is better if there are more minimums or maximums through which the trend line will pass.
Concept of bears and bulls
The term "bear market" is the opposite of a "bull trend," or a market in which security prices are rising or are expected to rise.
This phenomenon gets its name from the way a bear attacks its prey by standing on its hind legs and striking it downwards with its paws. A bull market is named after the way a bull attacks by pointing its horns upward.
Why bearish?
This type of market owes its name to the category of traders who play short and are called “bears” in stock exchange slang. At the same time, in no case should one assume that the label “bear” is stuck to the trader completely and irrevocably.
In fact, it is correct to talk about whether a trader is a “bull” or a “bear” only within the framework of one specific transaction. After all, after some time, the same trader (who is in a short position today) can open a long position on some other (or even the same) financial instrument, thus turning into a “bull”.
As you probably already understood, “bulls” are traders who play for higher prices. Bulls buy stocks in the hope that their prices will rise in the future. Well, why all the same “bulls” and “bears”, where does such a zoo come from**?
The answer to this question lies in the attack pattern of the respective animals. So the bull attacks, trying to hook his opponent on the horns and lift him up, and the bear, on the contrary, leans on the victim with all its weight, trying to press it with its paws to the very ground.
In the same way, bull traders open buy positions, thus increasing demand and, accordingly, pushing the price up. And bear traders create additional supply (they place positions for sale), which naturally pushes the price down.
** By the way, about the zoo. There are also players on the exchange called chickens and pigs. You can read more about this here: “Stock Market Basics: Bulls, Bears, Chickens and Pigs.”
What causes the bears to come?
The causes of a bear market often vary, but in general, a weak, slowing, or sluggish economy creates pessimism in the stock market. Signs of a weak or slowing economy typically include rising unemployment, low disposable income, low labor productivity and falling business profits. In addition, any government intervention in the economy can also trigger the arrival of bears.
For example, a change in tax taxes or the Central Bank rate can lead to a bearish trend. Likewise, a drop in investor confidence could signal the arrival of bears. When investors believe that something is about to happen, they take action - in this case, selling securities to avoid losses.
Candlestick patterns indicating a bearish reversal
Hanged
The Hanged Man is the bearish equivalent of a hammer. Usually formed at the end of an uptrend. A hanging candle has a small body and a long lower wick.
The lower price shows that there was a big sell-off, but the bulls managed to push the price higher momentarily. With this in mind, after a long uptrend, strong selling may be the first warning that the bulls will soon lose control of the price.
Falling star
A shooting star is formed when a candle has a long top wick, a tiny (or not so tiny) bottom wick, and a small body (ideally, the candle closes in the same place where it opened). A shooting star is similar in shape to an inverted hammer, but forms at the end of an uptrend rather than a downtrend.
A shooting star indicates that the price has reached its maximum level, and after a moment, sellers have taken control of the price, pushing it lower. Some traders using this formation choose to wait for the next few candles to confirm the shooting star formation without entering a trade.
Three black crows
The Three Black Crows pattern consists of three consecutive red falling candles, each of which opens inside the body of the previous candle and closes below the low of the previous candle.
Three black crows are the bear equivalent of three white soldiers. Ideally, these candles should not have long top wicks, which indicates constant selling pressure pushing the price lower and lower. The size of the candles and their length can be used as a measure of the likelihood of whether the price will continue to fall after the Three Crows appear on the chart.
Bearish Harami
A bearish harami consists of a long green candle followed by a small red candle whose body is entirely within the range of the previous green candle.
A bearish harami appears at the end of an uptrend, can form over two or more days, and indicates weakening demand from buyers.
Veil of dark clouds
A dark cloud cover consists of a red candle that opens above the close of the previous green candle and then closes below the central part of its body.
This formation is often accompanied by high volume, indicating a change in momentum and weakening growth momentum. Confirmation of formation is the appearance of another ancestral candle immediately after the formation of the dark cloud curtain.
Doji (Tombstone)
The Doji is one of the most important candlestick patterns on a chart. This candle occurs when the opening and closing prices are close to each other. According to Neeson, the Doji is one of the most important individual candlestick patterns on a chart. Doji can complement other patterns.
When the Doji appears in an uptrend, it can be a sign of greater indecision and an important price level being reached. Also, when they see a doji they say that demand is equal to supply. This indicates that the upward movement has stopped and can change to a downward movement at any moment.
A tombstone doji occurs when the difference between the opening and closing of a candle is minimal. There is no lower shadow under the body, but the upper shadow is very long. This formation can be read as a peak or also an important level on the chart.
Bearish engulfing pattern
An engulfing pattern consists of two candles and very often occurs at the end of a bullish trend, so it often indicates a reversal or an important level on the chart.
The second candle in the pattern should completely cover the body of the previous candle. We can say that the second candle seems to absorb the first one.
The bearish engulfing consists of two candles and is a preliminary signal of a trend reversal or the presence of an important level on the chart at this location.
We looked at the main patterns of Japanese candlesticks. Now we will present the most popular and well-performing figures, models and patterns that indicate a bearish reversal. Each of them is described in tabular form and recommendations for finding and trading are provided.
Phases
Bear markets usually have four phases.
- The first stage is characterized by high prices and the predominance of bullish sentiment among investors. Towards the end of this stage, investors begin to leave the exchange and take profits.
- In the second stage, stock prices begin to fall sharply, trading activity and corporate profits begin to decline, and economic indicators that may have once been positive decline to below average levels. Some investors are starting to panic due to falling stock markets. This is called surrender.
- The third stage shows that speculators begin to enter the exchange, increasing some prices and trading volumes.
- At the fourth stage, prices for securities continue to fall, but slowly. When low prices and good news begin to attract investors again, bearish sentiment gradually gives way to a bullish trend.
Things to remember
- A bear market is a time when assets plummet in value by 20% or more. Such a crisis can affect any investment, from stocks to bitcoin, and on average lasts about a year.
- Investors should not be afraid of a bear market; it is a natural part of the economic cycle. After a long period of growth, a decline inevitably comes.
- Nobody knows when the next crisis will begin. But you can prepare: diversify your investment portfolio, buy additional shares in sectors and put free money into a brokerage account.
- During a bear market, the main thing is not to panic and not to give away all your assets for next to nothing. It’s better to calm down and imagine that there is a sale around with huge discounts.
Differences from correction
A bearish trend should not be confused with a correction, which is a short-term trend lasting less than two months
.
While corrections are an opportune time for investors to find an entry point
, bear markets rarely provide suitable entry points.
This barrier is due to the fact that it is almost impossible to determine the bottom of a bear market.
Trying to recoup losses can be difficult unless investors are short sellers or are using other strategies to profit from a downtrend.
Between 1900 and 2022 there have been 33 bear markets, an average of one every 3.5 years.
One of the most recent coincided with the global financial crisis, which occurred between October 2007 and March 2009. During this time, the Dow Jones Industrial Average (DJIA) fell 54%. Since 2018, some analysts have been predicting that we are heading towards another bearish trend.
How can an investor protect himself from a bear market?
It is very difficult to predict a large-scale crisis, just as it is very difficult to immediately determine the difference between a small correction and a long decline. Economists and financial analysts try to estimate multiples, study industry data, volatility indices and investor sentiment. And although sometimes expert forecasts turn out to be correct, it is much easier to insure yourself in advance.
Diversify your portfolio
If capital is spread across different assets, then price declines will not be so painful. Stocks, bonds, cash, real estate, gold and bitcoin cannot fall at the same time or by much. An investor with a broadly diversified portfolio will lose less than his counterpart who invested only in technology or oil and gas companies.
Diversification will not protect against losses in the event of a large-scale crisis. But it is better to lose 25% than 40-50% on individual risky investments.
So, in 2008, almost everything collapsed in the stock markets. But a diversified portfolio that mixes a variety of asset classes was shown by Guide to the Markets - 2022, p. 61 / JPMorgan Asset Management is much better than most individual positions.
| Asset class | Fall, 2008 |
| Medium-term bonds | 5,2% |
| Cash/Treasury Bills | 1,8% |
| Diversified portfolio | −25,4% |
| High yield bonds | −26,9% |
| Small Cap Stocks | −33,8% |
| Goods | −35,6% |
| Large Cap Stocks | −37% |
| Real estate funds | −37,7% |
| Developed market stocks | −43,1% |
| Emerging Markets Stocks | −53,2% |
Hold bonds and assets from “defensive” sectors
Most often, during crises, the prices of risky assets fall, while bonds of states with a stable budget or large, reliable companies retain their value. Therefore, with a possible approaching economic crisis, it makes sense to purchase more bonds.
It is also worth taking a closer look at the sector shares. Firms from similar industries either do not lose money during crises or even earn more. You can pay attention, for example, to everyday goods (PepsiCo, Walmart, Magnit), telecommunications (Google, Rostelecom), healthcare (Pfizer, UnitedHealth), utilities (Consolidated Edison, RusHydro) and some industrial. ExxonMobil).
Have free money
It never hurts to keep part of your portfolio “cash”, that is, to have money not invested in anything in a brokerage account. Or at least short-term bonds: they are easy to sell at any time, and they bring in little money. An investor with free money will be able to adjust his own portfolio at any time and even buy promising assets cheaply.
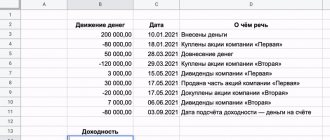
Short sales
Investors can profit in a bear market through short selling. This method involves selling borrowed shares and buying them back at lower prices. This is an extremely risky trade and can result in large losses if it does not work out. A day trader must borrow shares from a broker before placing a short sell order. The sum of the speculator's profit and loss is the difference between the price at which the shares were sold and the price at which they were bought back, called "covered".
For example, an investor sells 100 shares at a price of RUB 3,500. The price falls and the shares are covered at RUB 3,100. The investor makes a profit of RUB 400 x 100 = RUB 40,000. If a stock trades unexpectedly higher, the investor is forced to buy back shares at a premium, resulting in large losses.
Sideways trend or flat
This is the common name for a situation when the quotes of an analyzed asset on the financial market do not have a clear direction of movement and fluctuate within a horizontal range, bounded above by a resistance line and below by a support line.
Synonyms for the concept in question in trading slang are sideways, flat and horizontal price movements.
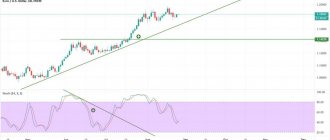
Graphic model
To illustrate this, let’s look at a section of the stock chart of PJSC OGK-2.
In the example given, the support line corresponds to the value of 0.3311 rubles, and the resistance line corresponds to 0.3899 rubles. Remember, asset prices move as they please within a sideways trend. Until quotes go beyond the horizontal range, it makes no sense to see any patterns in such fluctuations.
The upper and lower boundaries of the sidewall can be confirmed. This means that the asset’s prices have already tested them for a breakout, but turned around and moved in the opposite direction. In the example considered, the resistance line is confirmed.
How to earn?
When the quotes of the analyzed asset move within a sideways trend, we are interested in moments of close approaches to the upper or lower limit of the range. The meaning of the corridor trading strategy is simple.
When the price approaches the lower limit of the range, you should buy an investment instrument (open long) and place a stop loss immediately behind the support line. The idea is that the quotes will not break through the barrier, will turn around and move up. This will allow the trader to make money.
And vice versa. When the price approaches the upper limit of the range, you should short the investment instrument and place a stop loss immediately behind the resistance line. The idea is that the quotes will not break through the barrier, turn around and go down.
In the considered example with the shares of PJSC OGK-2, at the moment the level of 0.3311 rubles was reached again, it was necessary to open a long position and make a profit on the rebound.
Put options and inverse ETFs as ways to make money
A put option gives the owner the freedom, but not the responsibility, to sell shares at a certain price on or before a certain date. Put options can be used to speculate on falling stock prices and to hedge against falling prices to protect long portfolios. Investors must have options privileges in their accounts to make such trades.
Inverse ETFs are designed to move values in the opposite direction of the index they track. For example, an inverse S&P 500 ETF would increase 1% if the S&P 500 fell 1%. There are many leveraged inverse ETFs that increase the return of the index they track by 1.5x, 2x, and 3x. Like options, inverse ETFs can be used for speculation or to protect investment portfolios.
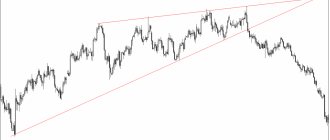
Breakout of the trend and change in direction of movement
Based on the physics of the process and the limited number of sellers and buyers, as well as the limited volume of goods, trends cannot continue forever. The first signs of a trend change may be the location of local maxima or minima not according to the rule. For example, with an ascending maximum, the price broke through the support line during the correction and the local minimum consolidated below the previous one. This may indicate either a temporary correction (an attempt by the bears to subjugate the market) or a reversal of the trend (when the bears finally took control of the situation).
An example of a trend reversal is shown in the figure.
Line breakout and trend change
In some situations, the main players need to gain strength and continue moving. Therefore, after the trend stops, the so-called horizontal corridor follows - consolidation, and then the previous trend continues.
Continuation of the trend
To analyze trend movements, you need to familiarize yourself with the materials in books on technical analysis. Namely, graphical analysis is a type of technical analysis that allows you to use technical analysis figures to identify reversals or continuation of a trend.
Short Selling Positions
One effective way to profit from a bearish market is to use short selling positions. At the same time, traders sell securities purchased using credit funds, and they are immediately repurchased at a more favorable cheap price. Such tactics are risky and can become unprofitable. But if everything goes well, the profit promises to be tangible. The assets are borrowed from the broker and placed for sale in the form of a short-term order. Profitability in this case is determined by the difference between the cost of sale and subsequent repurchase.
If you sell 100 securities worth 4,000 rubles, and then, after their price drops to 3,500 rubles, buy back the same volume of shares, then your income will be 500 rubles x 100 = 50,000 rubles. If suddenly the price does not fall, but rises, then the trader finds himself in the red.