Everyone knows the expression “the trend is a trader’s friend,” but what to do when there is no clearly defined movement in the market and the price moves in a horizontal channel? You can, of course, just sit and wait for the price to determine the direction of movement, but why waste time if you can also trade in a flat. Moreover, trading often turns out to be quite effective, albeit with smaller goals for the transaction than when trading with a trend.
I personally came across how in the DC “teachers” simply hammered into the heads of novice traders that trading during a flat is like death. Hence the skepticism among many. In fact, losing a deposit depends little on what market a person trades on. If he has a problem with self-control, then neither a strong trend nor excellent entry points will save him. There is only one conclusion from this - do not take into account the scary stories about losing money when trading flat, but rather familiarize yourself with the rules of working in such a market.
What is a flat and how to determine it?
A flat is understood as a price movement in a horizontal channel when the chart cannot break through either resistance or support for a long time. The channel does not have to be narrow; the range may well be tens or hundreds of points; here everything depends on the selected time interval.
At the same time, within the framework of a flat on a higher time interval, good trend movements on lower time frames may well be observed. For example, if on D1 it seems that the price is stuck in a flat and the market is calm, then it is enough to go down to H1-H4 to see good trend movements. So flat is a relative concept.
The main problem is how to recognize the state of the market at the current moment. There are no problems in history, you can immediately see where the trend section of the chart is and where it is not, problems begin when there is emptiness on the right side of the screen and you don’t know whether the trend will continue or whether calm has already begun.
In principle, a flat can be recognized purely visually; you just need to zoom out on the chart and look at the price behavior. But in this case it is hardly worth talking about the accuracy and reliability of the forecast; after all, this method is only suitable for assessing the situation in general. Well, it’s very easy to make a mistake.
But the state of the market can also be determined using indicators. Moreover, you can use both standard MT4 trend indicators and custom algorithms.
Reasons for appearance
There are several reasons for the appearance of a flat on the stock exchange.
1) This is a decrease in the volume of trade contracts on holidays and vacation days. A small amount of funds is unable to cause a powerful movement in the market.
2) Before the announcement of fundamental news or the results of decisions in the government, political, and financial spheres, the market also freezes and waits for a powerful breakthrough.
3) The same effect is produced by anticipation of intervention or decisions of the Central Bank on rates.
4) The situation when the volumes of bullish contracts are balanced by bearish rates forces traders to go flat. Although trade takes place in large volumes, demand is offset by supply.
5) When rumors arise about events whose consequences can be interpreted in two ways, players prefer to wait and make sure in the direction of the trend. And even the announcement of expected information does not always cause it.
6) It happens that a flat occurs when assets are accumulated or dumped by market makers. Given their volumes, they can easily cause strong price changes, and will be forced to buy more or sell less than is profitable for them. So they buy or sell slowly, keeping the currency in a narrow range with large stop orders.
Types of flat on Forex
Although we agreed to consider a flat as a price movement in a horizontal channel, in reality everything is a little more complicated. And the flat can also be different depending on the nature of the price movement (although the basic postulate is not violated - neither bulls nor bears can defeat each other).
The following types of flat can be distinguished:
• classic – the same horizontal channel. We can say that the price moves in a box; the lines acting as support and resistance are strictly horizontal. In a classic flat there are no sharp price jerks, the movement is soft and measured - trading is a pleasure;
• “ragged” flat – the same, but there are sharp price jerks from support to resistance, the distance is covered by literally 1-2 candles;
• with some stretch, price movement in a channel with a very small slope can also be considered a flat. This corresponds to the logic of what is happening in the market - the forces of sellers and buyers are almost equal, hence the impossibility of a clearly defined directional movement.
What indicators can be used to diagnose a flat?
If you try to list all the algorithms suitable for this, the list will turn out to be too impressive, so we will limit ourselves to only proven options:
• moving averages. 2-3 MAs with different periods are used; a flat is indicated by segments of the market in which all indicator lines are strongly intertwined with each other. You can add moving averages to the chart yourself, or you can use Bill Williams’ Alligator (it works on the same principle). The only inconvenience is that you will have to tinker with the moving average settings, namely selecting MA periods, but the result is worth it;
• Bollinger Bands – areas of the market indicate a flat when the boundaries of the bands are parallel to each other and the distance between them is not very large. The middle line of the bands is a moving average. Just as in the previous case, you will have to tinker with the Bollinger Bands settings;
• Pulse Flat – suitable for small time frames and determining the market state is only a small part of the extensive list of its capabilities. The author recommends using this algorithm on time intervals up to H1; above that, serious delays begin and it is impossible to work using it. If you plan to use it to determine the state of the market, then you can ignore the histogram; in this case, you will be interested in the color of the horizontal line. If it is yellow, then the market is trending, green – the market is flat. The indicator is quite taxing on your PC, so don’t add it to 5-10 currency pairs at once. If the settings are incorrectly selected, it does not work quite adequately, reacting too strongly to the slightest price fluctuation;
• another simple but fairly reliable indicator is iVar (stands for variation index). After adding it to the chart, the trader will see only one line, and its position relative to level 50 will be used to identify the state of the market. If the line is above this level, then it is considered that the market is flat or at least the movement is weakly expressed, but if the indicator line falls below 50 – wait for directional movement. You can download the indicator here.
• Flat indicator. Another algorithm from the custom category is displayed on the graph either as a line or as red and black columns. In the case of columns, a red color indicates a flat;
• Xaser indicator is one of the simplest, but at the same time functional. It is far from the same appearance as Pulse Flat, but it does its job, and we value indicators primarily for their usefulness, and not for their appearance. After adding it to the chart, you will see only one line, which will either stick to the zero mark or move away from it. When the line is at zero, the market is flat; when the indicator shows any value other than zero, there is a trend movement in the market. You can download the indicator here.
In principle, the list can be continued indefinitely; you can use other indicators, the same Ichimoku or envelopes. But those listed are quite enough to identify the state of the market.
Combining the best trading tools
As we can see from this article, every tool and concept has its own advantages and limitations - nothing will work all the time. However, it is not necessary that you find a way to achieve 100% winrate (which will not happen anyway), since your wins are greater than your losses.
In the end, it all comes down to how well you choose your trading tools, how well you understand them, and how good you are when it comes to applying them to market conditions.
- Tweet
- Share 0
- +1
- LinkedIn 0
- VKontakte
Method of working in flat
I will briefly describe the tactics of working on a trend and when the price moves in a horizontal channel:
• during a trend, the trader seeks to enter the market at the end of the correction - this is the most common and most reliable tactic of working in the market. I can’t recommend countertrend strategies to anyone because they involve considerable risk;
• in a flat, trading can be carried out in two ways: on a rebound from the boundaries of a horizontal channel or on a breakdown of the range boundary. Both styles have a right to exist - rebound trading from the channel boundaries is especially good in a “quiet market,” that is, when the main players are out of business. There are even special advisors - night scalpers, who trade only during the Asian session; they specifically implement trading based on price movement in a narrow range. Breakout strategies allow you to catch the moment of trend formation or at least a strong movement.
Strengths and weaknesses of lateral movement
Before we continue and consider the types and methods of making money in flat trading on Forex, we first need to describe its features in the form of strengths and weaknesses that need to be taken into account. Let's start with the disadvantages:
- the price does not demonstrate a clear desire to move in a certain direction, which is why the probability of an entry greatly increases, after which the market will immediately reverse;
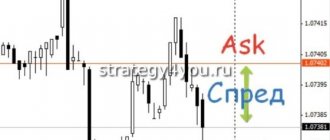
- During periods of uncertainty, the spread usually increases, which leads to an increase in trading costs, significantly worsening the results of some strategies - in particular, scalping ones.
But the flat also has its advantages, due to which many traders trade exclusively during the Asian session or tirelessly search for narrow ranges throughout the day using special indicators. We are talking about the following strengths of lateral movement:
- absence of random and strong price impulses, also known as takeaways;
- the ability to work from clear and understandable levels of resistance and support;
- almost zero slippage during market execution.
Thus, the market during a flat period disappoints some traders and pleases others. To be among the latter, you need to know how to use sideways movement to your advantage by mastering simple trading techniques. But first you need to understand that flat on Forex can also be different and this is extremely important to take into account in your trading.
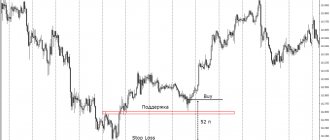
Trading on a rebound from the range boundaries
The key question in this tactic is how to recognize when the price will bounce off the range boundary and when it will break through it. There are a couple of tricks here that can really make life easier.
Indicators from the “Oscillators” group of the trading terminal work well in flats. The same Stochastic in a horizontal channel shows reversal points with a high degree of accuracy. If, for example, the price approached the upper border of the designated channel, that is, to powerful resistance, and on Stochastic at that time the lines crossed and left the overbought zone - this is a powerful signal for sales.
We act similarly in a situation where the price has reached the lower border of the channel, and the Stochastic lines at this time have left the oversold zone. It is doubly good if the price rebound from resistance/support is also confirmed by some candlestick pattern. The value of such a signal increases significantly.
A separate warning to overjoyed traders - the ideal use case for Stochastic is a calm market in which the price moves almost in a sinusoid. In this case, the oscillator will produce signals with virtually no delay. But on an equal flat, problems are possible - the price sometimes remains in the horizontal channel, but covers the entire distance between the lines with literally 1-2 candles. In such a situation, while you wait for a signal from Stochastic, it will no longer be relevant.
During a trend, it is better not to use Stochastic (except to search for the end points of the correction). With strong movement, the oscillator lines can stick for a long time in the oversold/overbought area and generate one false signal after another.
WPR indicator – a solution to the problem of “ragged” flat
This algorithm is also one of the standard MT4 indicators; the calculation principle is quite similar to Stochastic. But unlike it, the scale of William's Percent Range is directed in the negative direction, from 0 to -100. Another significant difference is that the lines are not smoothed, unlike Stochastic. Therefore, WPR on the chart looks like a broken line that reacts sharply to any price change.
The principle of use is the same as that of Stochastic - we wait until the indicator line enters the zone 0 - -20 or -80 - -100 and trade when it turns and leaves it. There is also a more interesting option for using WPR, which is suitable specifically for sudden price movements in a horizontal channel. You just need to wait until the line reaches 0 or -100 and enter the market in the opposite direction. Practice shows that such entries are very rarely closed with a stop; in extreme cases, the market always gives the opportunity to move the transaction to breakeven.
WPR is good because, unlike Stochastic, it can work on a ragged flat, but during a calm price movement it gives more false signals. Just like Stochastic, it does not work well in trend areas of the chart.
It's best to use them in pairs. You will use stochastic in a calm part of the market. And WPR will come in handy when sudden movements occur.
The most flat currency pairs
USD/CHF is in a flat period.
Each trader chooses his own trading strategy. There are those who choose quieter trading on flat currency pairs. The period of consolidation is suitable for them. This is also a great opportunity for beginners to try trading in real conditions.
For reference! The calmest currency pairs have another big advantage. Spreads in such pairs are among the lowest on the market.
All pairs containing the Australian dollar are sideways most of the time. In addition, trading instruments during the Pacific trading session are characterized by weak fluctuations. But at the same time, the GBP/AUD pair is one of the most turbulent.
For example, one of the calmest USD/CHF pairs may show huge gaps when interest rates are adjusted. Therefore, you will have to identify low-volatility pairs yourself. To do this, you need to choose periods of calm in the market, lack of important news and other factors.
Trading on channel breakdown
The longer the flat lasts in the market, the stronger the exit from it will be. This is an axiom; if you look at the history on the chart, you will see this simple truth for yourself. As for breakout trading, it is important to be able to distinguish a true breakout from a false one. That is, it is not enough for the price to simply go beyond the horizontal channel; it must consolidate behind the broken support/resistance.
With this tactic, several behavioral strategies are possible:
• cover the horizontal channel with pending orders and calmly go about your business. For each delay, I would recommend placing a stop loss behind the opposite border of the channel. Such work brings good results before important news if the price freezes before its release. If news comes out unexpected, impulse movement is almost 100% guaranteed. Sometimes it can reach hundreds of points, although usually everything costs a few dozen points. Pending orders in such a situation allow you to snatch a good profit literally in a matter of seconds;
• wait for the breakout and its confirmation (more on this below).
If we compare the described work methods, the first is good because it does not require the trader to constantly be at the monitor. Sometimes it’s enough to just monitor the situation to see if the price has knocked down a pending order. On the other hand, the size of the stop is not encouraging, because it is equal to the width of the channel, and in general the situation may turn out to be such that in a real situation you would not have entered the market, but the pending order has already been triggered and there is nowhere to go.
The second method will require time from you, but this is not its main drawback; what’s worse is that the price does not always confirm the breakout and the entry point. That is, you can miss a good entry simply because all the conditions for concluding a deal have not been met. On the other hand, due to the safety net and the additional filter of the truth of the breakout, we get a higher percentage of profitable trades.
There are several confirmations of the truth of the breakdown:
• During a true breakout, volumes often increase sharply. If you use volumes in trading, be sure to track their changes;
• immediately before the breakout, the price seems to take a short break, then the resistance/support breaks through in one go. DeMark spoke about this price behavior, so this is a classic sign of a true breakout;
• a retest of the broken resistance occurs. After a breakout, the price may go far, but in an ideal case it returns and retests the constructed line. An additional signal is the formation of a reversal candle combination at this moment.
Unfortunately, all of the listed signs are very rare at the same time, but this does not mean that you need to constantly look for the ideal and miss one good entry after another. Of the listed criteria, I would advise waiting for a retest - this is one of the most important criteria for the authenticity of a breakdown. If the other signs are also met, you can simply increase the risk on the transaction a little, but you must admit that it would be stupid to miss the moment to conclude a transaction just because there is no suitable candlestick pattern or the volumes do not suit you.
In this example, there were several reasons for entering the market:
• directly on the breakout candle there is a sharp increase in volumes;
• the breakdown occurred sharply and confidently, with one candle;
• after the breakout, the price issued a retest, it was possible to enter at the close of this candle;
• in this situation, it would be logical to place a stop loss behind the last local maximum, and the TR should be equal to at least the width of the channel from which the price came out. In principle, this is a good preparation for a trading system based on technical analysis.
Bollinger Bands + Stochastic Strategy
This combination of indicators is one of the simplest that you can come up with. An additional advantage is that Bollinger Bands will act as the boundaries of the horizontal channel for a rebound from which we will trade.
So, to work we need the Bollinger Bands and Stochastic indicators (both indicators are included in the list of standard MT4 indicators). The work will be carried out in the following sequence:
• first we need to determine a flat in the market or a directional movement. If there is a flat, then the Bollinger Bands will be parallel to each other and directed horizontally or with a slight slope. Another argument in favor of a flat is the small distance between the indicator lines compared to the recent movement of the indicator;
• then add Stochastic and observe how the price behaves when approaching the BB border.
In our example, the price gave as many as 3 good entry points. Please note that each time the price approached the lower border of the Bollinger Bands, candles with long shadows below were formed. This only strengthened the received signal.
Since the range of price movement is already small, it was possible to enter the market not after the Stochastic lines left the oversold zone, but immediately after the price rebounded from the Bollinger Band, and the Stochastic lines crossed while in the oversold zone .
Introduction: Different Market Phases
Before I start talking about how to spot a trend, we must first understand what we are looking for. Markets can do one of three things: go up, down, or move sideways.
The figure above shows the three possible scenarios and how markets alternate between phases. But knowing what happened after the fact is always the easy part. The hard part is figuring out what's happening in real time, and this article is about the empty space on the right (of your terminal). Let me be clear, this article is not intended to show you how to identify trade entries, but to give you a better understanding of price and trends.
Moving Average + Stochastic strategy
The following strategy is a small distillation of ideas from the once sensational “Conservative Intraday Scalping”. In principle, the idea remains the same, it’s just that moving averages, rather than Bollinger Bands, will be used to determine the boundaries of the horizontal channel.
In order to get a channel from moving averages, the MA will need to be shifted vertically by a certain number of points. The shift is selected individually in each specific case; you need to ensure that during a calm market the price does not go outside the channel for a long time.
For our case, the optimal vertical MA shift was 250 points (for a five-digit figure), resulting in a channel with a width of 500 points. If we compare it with the screenshot above, where we used Bollinger Bands, we will see that the picture is almost identical. This is understandable, because moving averages are also used when constructing explosives.
The entry points were almost the same as when using Bollinger bands.
An unusual method of using RSI during a flat
The relative strength index indicator can be used not only to look for divergences or to identify points when the price is in the oversold/overbought zone.
During a flat, when the price moves in the channel, you can switch to a lower time frame and build trend lines on the price chart, trading for their breakdown. In this case, the channel boundaries act as a guide when setting TP and SL. The only problem is that due to the fact that the price moves sluggishly, graphical constructions on the chart are not always possible; there are simply no significant extremes on which to work.
In such cases, sometimes they resort to graphical constructions directly on the oscillators themselves (Stochastics or RSI; in the example, the Relative Strength Index indicator will be used).
This approach works much better in trend areas, where the breakdown of lines on the RSI often happens much earlier than it happens on the chart itself. But this method also works in flat trading. Sometimes a signal can be received really long before the price chart gives the opportunity to enter the market (and sometimes no signal appears on the chart itself at all).