The price in the process of stock trading never stands still.
It continuously moves in a certain direction. Many factors influence the change in quotes. The main one is an equal balance between supply and demand. The order book is used to analyze this equilibrium. Let's take a closer look at what it is and why this tool is needed. What is a glass on the stock exchange and its purpose?
The order book is a list in numerical terms of current orders to buy/sell a certain asset at a price set by trading participants. Representing an indicator, the glass for Forex and for the stock exchange serves as a reflection of the mood of traders in the market. This important tool for a market participant is also called Order Book, Open Book, Depth of Market, which literally translates as market depth.
To explain it more simply, the order book is a table that reflects data on orders submitted by the selling and buying parties at the moment.
During the trading session, every second the exchange records and brings together many orders from buyers and sellers. At the same time, the glass is only a visual form of limit orders that are close to the current price.
If you analyze this exchange instrument, you can objectively assess the ratio of supply and demand currently for the desired asset. Traders who prefer those. analysis, use the Order Book to determine the minimum resistance level for price movement. In addition, using the order book, the trader has the opportunity to make short-term forecasts. This method is effective in scalping, since there is an opinion: if placed orders disappear quickly in a single direction, the price movement will also soon take the same direction.
The order book differs from price charts mainly in that the book does not visually reflect the situation on the market. It only serves as a reflection of submitted orders that are close to the market. The execution of these orders somehow influences subsequent pricing. If a trading participant understands the interpretation of the order book, he will be able to understand the market situation from the inside and know where large orders are located, and understand price formation in real mode.
In addition, the trading order book allows you to record uneven liquidity in equidistant orders. In other words, a trader can assess the preponderance of supply or demand in the market, as well as identify price levels with maximum liquidity.
What is the principle of the order book?
The rise or fall in the price of an asset is related to the distribution of supply/demand for that asset. They also depend on the actions performed by traders.
Every market is an auction in which two parties participate. Suppose one participant decided to sell 5 lots of a certain asset. To do this, a second party is needed - a buyer who has expressed a desire to purchase the asset in the proposed volume at a set price. So a deal is concluded between them, and a huge number of them happen on the stock exchange every second.
Price glass: how to use it skillfully?
This tool should be used to enter the market in order to maintain your position for several sessions. To use it skillfully, traders must:
- Combine the order book with transaction information to know which trading offers were implemented.
- Additionally use other analytical methods.
- Treat other traders' orders critically. Manipulations and tricks are found on the stock exchange much more often than it seems.
Types of orders in the order book
There are 3 types of orders:
- Market orders are orders to buy or sell an asset, which are executed at the best market price in the required volume.
- Limit orders are regular orders that provide for the required asset, its value and the required volume.
Conditional – all orders that provide for the fulfillment of conditions set by the trader, except limit ones.
Only limit orders are visible in the order book. Market ones cannot be seen in it, since they are executed instantly at the best prices. Conditional ones are also not displayed, since they are expected to wait for the occurrence of those conditions under which they will be limit/market conditions.
Orders are also divided into small, medium and large. This classification is considered conditional. The division is carried out in relation to the average daily trading volumes for an asset on a particular exchange. For example, if the average volume of transactions per day for a futures contract on the RTS index is equal to one million contracts per trading session, an order for 2000-5000 futures is large and should be closely monitored.
Considering this average daily volume of applications, we can distinguish the following types:
Small – applications for 20–100 contracts. These orders do not affect the formation of the asset price; such a number of contracts does not deserve the close attention of trading participants.- Medium – the volumes of these orders range from 400 to 1,000 contracts. They are more significant than the previous ones, but only if a lot of them accumulate in a narrow price range. Due to the density of orders, a large volume is created, which puts pressure on prices.
- Large orders are orders ranging from 4,000 to 10,000 contracts. They are quite significant in terms of influence on price formation. Because of their influence on price fluctuations, they are closely monitored by traders, who take them into account when planning their work and making trading decisions.
Key elements of a glass
To trade with limit orders, you need to learn how to read the market depth on the exchange. Let's consider what elements it consists of.
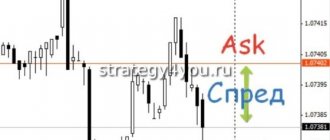
Bid. It is usually illuminated in green. Characterizes the amount of demand. Shows the number of applications and the buyer's price. An investor should analyze these figures if he wants to sell his assets at a higher price. The lower the rows in the table, the worse (lower) the price for the seller.
Ask. Characterizes the amount of supply. Illuminated in red. Shows the number of applications and the seller's price. If you are going to buy assets, you must analyze the red zone. The higher the rows in the table, the worse (higher) the price for the buyer.
The best supply and demand values are in the middle of the table. The spread is located on the border of the red and green zones. This is the difference between Ask and Bid. On our screen, the spread is 233.85 – 233.79 = 0.06 rubles.
The depth of the order book shows the number of lines in the green and red zones. It can be adjusted. The standard depth is 20 lines up and 20 lines down. For example, at the VTB broker you can set 1, 3, 5, 10 and 20 lines.
The table may show, for example, only the green zone. This means that there are buyer orders in the market, but no seller orders. The situation is the opposite with the red zone – there are sellers, but no buyers.
Aggressive and passive orders
In addition to types and volumes, there is a division of orders according to their strategic purpose. They are aggressive and passive.
Buy and sell orders placed statically at prices close in value, without movement, are passive. They appear to be defending some price point and are not considered aggressive. The order book shows passive orders at moments when the market approaches strong FP levels. Due to the confrontation between buyers and sellers, the level will be broken or the price will rebound from it.
Market orders are classified as aggressive. Typically, it is precisely such orders that are considered the driver of quotes. Aggressive orders can be limited, however, they show a constant movement in the direction of changing quotes. They are characterized by a sudden appearance in the order book when prices jump in a certain direction. They push prices, constantly striving for the current value. Such movements of orders allow you to maintain the market direction for a long time.
Often both types of requests interact with each other. Market depth is a reflection of this interaction. When the support line is broken, it turns into a resistance level. At this moment, the order book overcomes the accumulation of passive orders, after which sellers aggressively enter the market and place orders at the nearest Ask price values. Therefore, in order for the trend to reverse upward, it is necessary to break through the resistance level, which is actively defended by a large number of market participants.
The density of passive orders is also used to set a Stop Loss order. If, after a transaction is opened, large sellers appear on the market and the price movement is directed from top to bottom, you can confidently set Stop Loss a couple of marks above the seller’s price. It is better to close a transaction if a large order is “eaten up” by the market. This can automatically push prices up.
Tricks from big traders
A classic deception is creating the illusion of the chart moving in one direction in order to force ordinary traders to enter the market. It happens something like this:
- A large Ask is issued (not an iceberg, but a regular offer). It seems that there is strong resistance to further growth. Some traders will not buy and will begin to look for opportunities to sell.
- Simultaneously with the Ask, a major player gains volume with a Bid , hiding it from others using an iceberg order. As an option, transactions are made according to the market, but the volume is divided into parts so as not to attract unnecessary attention.
- When the required number of lots has been purchased, the Ask is removed , and instead a large offer to buy is placed. The crowd believes that a downward movement is now excluded, and purchase transactions are made. Some traders who previously opened short positions get rid of them, also entering into buy transactions.
- Due to this scheme, a major player gains volume at a favorable price and leaves ordinary traders no choice. They are forced to move the price to where the big man originally planned.
As for how to understand the order book on the stock exchange, you can’t do without a transaction tape. In the example discussed above, an experienced trader could have suspected something was wrong when analyzing the positions being opened. Level II without data on real transactions does not allow this.
Other techniques are also used . For example, instead of setting a “slab” in the form of a large offer, traders manually or with the help of robots buy/sell at a certain level, protecting it. Level II is useless in such a scenario; you will not be able to understand through it exactly where the interest of a large trader is.
Analysis of the order book and its use in trading
In practice, the importance of the exchange order book for a trading participant is the ability to observe the pressure of traders on the price of an asset. The ability to interpret the order book allows you to find ways to influence the weak points of market participants.
By analyzing the depth of the market, its participants can clearly notice the factors that significantly influence the formation of the price of an asset. According to their vision of the market, they can enter and exit the market correctly.
The Depth of Quotes is almost the only tool among the classic technical indicators. analysis that works proactively. It is often recommended to use it as an additional technical tool. analysis. For example, when identifying powerful levels, to determine the likelihood of a price rebound, you should pay attention to the list of nearest limit orders.
An excess of the total sales volume compared to the purchase volume signals the possibility of opening a position. Under opposite conditions, it is better not to rush into opening a transaction, since the market is in a state of uncertainty.
Next, we will consider what points you need to pay attention to when analyzing the depth of the market.
How to trade using depth of market?
Since Market Depth is an analytical trading tool, its use gives players an understanding of the factors that directly affect the fluctuation of an asset's value (volatility). This makes it possible to predict subsequent potential changes.
To obtain comprehensive reporting information about the market, it is recommended to use the market depth of market in combination with other analysis tools.
Large orders
When interpreting the order book, you should pay attention to orders with above average volume. Large orders deserve special attention if:
- the location of a large order is at the maximum or minimum value of the trading session. After a strong trend, traders take profits. In this situation, a large order indicates the price level at which the majority of positions will be closed, and a trend change may also occur;
- the appearance of a large order after a flat. Sometimes, against the background of weak activity of market participants, a volume order is placed nearby with the best price value. Then you should pay attention to the direction of movement in which the order appeared, and how the market reacted to it;
- a large application is submitted at the PS level. This order may have the purpose of holding the price at this level or the purpose of gaining a position, for this reason it can be used as a guide when opening your position. In the process of trading for a rebound from the PS line, it is advisable to place a Stop Loss immediately after such an order. When trading liquid assets on a breakout, you can also place a Stop Loss immediately after the order.
Iceberg orders
This type of order includes 2 parts: open and hidden. For example, the open part (visible) if there are 100 lots for sale at a price of $95. When the declared volume is realized, a similar order appears and this continues until the entire volume is purchased. That is, this entire volume is a hidden part.
This ordering scheme is used to hide very large orders to prevent price fluctuations. At the Moscow Exchange, it is allowed to use a ratio of visible and hidden parts in the ratio of 1:100. And yet, traders resort to personal algorithms to place iceberg orders with different parameters. They can be seen in the order book when one order is repeated several times.
To track orders, a trader can use an order feed called Level 1. The order book itself is Level 2. The feed makes it easier to visually perceive orders that are repeated in iceberg orders.
In the figure, the quote book is located on the left side, and the order tape is on the right.
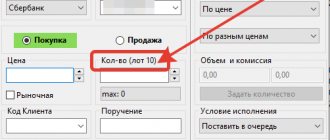
What are we limiting?
The price and volume of the goods you want to buy or sell.
For example, imagine that you are trading glazed cheese curds (although it is unlikely that anyone would trade them on the stock exchange and even with an order book, but still).
Vasya sells 100 glazed cheesecakes for 10 rubles apiece, Kolya sells 200 cheesecakes for 9 rubles apiece, and Katya loves cheesecakes so much that she is ready to buy 50 pieces at once, but for a maximum of 8 rubles.
As you can see, they trade in lots of 50, 100 and 200 pieces. The purchase price and selling price of cheese curds are also specified to the nearest ruble. This is what it means to limit.
This is what a stock glass for glazed cheese curds would look like
Pulse
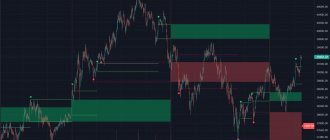
When a new trend emerges, the new impulse is reflected in the order book differently, in contrast to the usual price fluctuation. For example, if a price increase is demonstrated, a correction from the last maximum extreme is currently taking place.
Before the resumption of the bullish trend and the breakout after this resistance level, the order book shows an almost complete absence of buyers, but at the same time a dense formation of sell orders of medium volumes. Despite the fact that the number of requests for a reduction is significantly greater, most likely there will be a confident increase in the price. This is explained by the market moving from volume to volume.
The market is designed in such a way that price movement is directed against the crowd. When the majority of traders are looking to sell an asset, especially during an uptrend, there is a high probability of their orders being absorbed. They are clearly visible in the order book, for this reason you should enter to buy after the correction. That is, immediately after it becomes noticeable that growth has resumed and the balance in the book of quotes has shifted.
Recurring orders
If a large trader does not have the opportunity to open a deal on the over-the-counter market, various techniques are used to gain positions in the order book without being detected. One of them is the inclusion of an algorithm that purchases or sells a certain volume of lots at market value at set time intervals. For example, the same volume at a given interval or varying volume at random time intervals.
Flipping technology
Flipping is an algorithm for position selection. It is based on placing limit orders in the same direction to give them the appearance of strength, while the accumulation of positions occurs in the other direction. This technology is implemented mainly using a volumetric Ask value at the top and an iceberg Bid order at the bottom. As the iceberg order is executed, the volume Ask is removed from above, and the volume Bid is installed from below. Traders who initially opened bearish trades are faced with the need to close them, thereby pushing prices up.
Interaction of aggressive and passive orders
Let's consider a situation in which quotes are approaching a strong resistance level with the intention of breaking through it soon. In the order book at this moment you can see how aggressive and passive orders interact. In this case, you can choose one of three options:
- Do not open trades and just observe. After the interaction of orders in the consolidation zone stops, it is possible to open a position on a rollback of a new trend.
- Open a sell transaction with Stop Loss set outside the volume passive order. In this situation, the position is designed for a quote rollback and sale at a higher price.
- Wait until the accumulated passive orders are broken and immediately open a bullish position with an aggressive trader.
Ranges without prices
Sometimes in the order book you will notice how the table is divided into unequal ranges in which there are no prices. This often indicates that the market is divided into a number of dominant groups, each of which has its own goals regarding the asset being traded. If you place an order in these ranges, this will help accelerate price consolidation at the updated level and make massive purchases of the asset. But if the order is not large, it may get stuck between market orders.
Depth of Market demonstrates the beginning of a massive sale of an asset or the accumulation of positions for a breakout in the upward direction. In this case, to obtain a guaranteed profit, it is worth joining a more dominant group.
Efficiency of using Depth of Market
Just a decade ago, market participants could not imagine trading without using market book data. However, the effectiveness of this data is now questionable. Many reliable and profitable strategies are created every year. Due to the continuous improvement of trading methods, traders use order book summaries less and less often without considering them useful. The reasons for this ineffectiveness include the following:
- A huge number of hidden orders does not allow us to fully assess the current market condition. Large exchange platforms carry out transactions every day that amount to more than one million US dollars. Moreover, the Order Book often shows only one lot, which means a position of only one hundred units of a trading instrument. This fact completely contradicts the logic of trading, since such a volume cannot fit into just one hundred contracts. In reality there are many more positions, but hidden orders allow you to see only one lot. All traders can hide orders, however, the market maker who provides pricing has the greatest benefit from this. For other traders who rely on table summaries, this only contributes to large losses.
- Fictitious applications. Large stock market participants often use fictitious ordering techniques to profit from the inexperience of many players. This technique is based on placing a Bid or Ask at a certain price level. At the moment of concluding purchase transactions and setting Stop Loss by other traders, the major player removes the fictitious order and makes a profit from the losses of inexperienced traders. Traps of this nature, repeated every trading session, bring them billions of dollars in profit. Such machinations can only be noticed with the correct interpretation of the price chart.
- Erroneous signals. It often happens that the technical indicator. analysis generates a signal that the trend continues. At the same time, the stock order book demonstrates the opposite situation. This can lead to unpleasant consequences for the trader. Due to the fact that concluded transactions are partially depicted, the order book shows incorrect information. It prevents the trader from reliably assessing the situation. To avoid confusion, you should use the order feed, which includes complete data on all exchange transactions. This confirms the price movement of a particular asset. In addition, the tape does not hide the actual number of lots, as well as the machinations of market makers.
Is it possible to effectively use Depth of Market? Of course yes. However, it should be taken into account that trading performance will improve if the participant is able to compare the performance of several instruments at once. For example, Depth of Market reports should be viewed in addition to the order feed or price chart data. Then it will be possible to obtain reliable exchange data and open positions in accordance with the strategy for increasing their profitability.
Where to start trading
If the stock market seems too complicated, you can start working with CFDs on shares. In terms of trading conditions and the number of available assets, I recommend AMarkets. In the tables I will give the main characteristics and tariffs of the broker.
| Company | AMarkets | ||
| Rates | Standard | Fixed | ECN |
| Minimum deposit | 100$/100€ or 5000₽ | 200$/200€ or 14,000₽ | |
| Recommended capital | 1000$ | 50 000$ | |
| Leverage | 1 in 1000 | 1 to 200 | |
| Spread, points | Floating, from 1.3 | Fixed, from 3 | Floating, from 0 |
| Commission | No | 2.5$, 2.5€ or 175₽ for 1 lot one way | |
| Minimum Margin | 1$ | 5$ | |
| Stop Out | 20% | 40% | |
| Exiting client transactions to the interbank market | No | Yes | |
| Ability to place pending orders inside the spread | No | Yes | |
| Requotes | Eat | Their absence is guaranteed | |
| Open an account | |||
| Criterion | AMarkets |
| Regulation | The Financial Commission |
| Minimum capital | From $100, €100, 5000 RUB for standard accounts |
| Number of assets | 100+ |
| Recommended capital | $1000 |
| Account currency | USD, EUR, RUB |
| Maximum leverage | 1 to 1000, on ECN – 1 to 200 |
| Spread in points | Floating, from 0 for ECN, fixed from 3 |
| Commission | $2.5, €2.5 or ₽175 for 1 lot one way for ECN |
| Execution speed, ms | 53,3 – 70,0 |
| Stop Out | 20-40% |
| Exiting client transactions to the interbank market | + |
| Number of positions | No limits |
| Pending orders inside the spread | + |
| Requotes | — |
| Limiting the number of transactions | Absent |
| Limit orders inside the spread | + |
| Availability quote | — |
| Own indicators | Cayman (market sentiment) and COT (provides information from the Commodity Futures Trading Commission) |
| Peculiarities | Welcome bonus up to $10,000. Cashback, there are tournaments and other incentives for traders |
If you decide to switch to Amarkets, I recommend taking a closer look at the welcome bonus . This is a real opportunity to get your first deposit with minimal effort. Previously, a separate post was published about a no deposit bonus on Forex. In it, this pleasant moment was examined in more detail.
Open a Forex account in AMarkets
Market book on Forex
Currently, the Order Book is a stock exchange tool; it does not appear to be a complete tool on the foreign exchange market. Moreover, some brokerage companies can provide tools similar to the order book for MetaTrader 4 and 5 terminals.
The few companies that show market orders to their trading participants use information from only one of the exchanges or show orders only from their clients.
Trader orders are controlled and taken into account only within one market, for example, on the Moscow Exchange. In this case, the exchange is engaged in recording all the actions of traders online, and this allows it to display information in their terminals.
Forex is a whole market system, and it is better to consider applications from each market separately.
At the same time, Forex, being the most liquid international system, cannot reflect the orders of all existing interbank systems. Namely, they are the components of Forex liquidity. For this reason, even if any Forex broker or dealing center promises to provide a real book of quotes, this cannot be true. Most likely this is just a publicity stunt.
Sometimes large brokerage companies provide information on orders from market players for a particular asset. This data can be reflected in the form of a glass or a two-color indicator showing the percentage of bulls and bears.
Naturally, such information cannot reflect the real situation. The fact that a given asset is currently dominated by buyers or sellers does not mean that the same market sentiment prevails throughout Forex. For this reason, it is not recommended to rely on this type of internal information.
Summary
In stock trading, the glass and deal tape are useful tools. They help to understand the true intentions of other traders, in particular large players who can influence the movement of the chart. For intraday work, the use of Level I and II is recommended for everyone without exception. If trading is carried out on higher timeframes (H4 and higher), you can do without studying the orders of other traders.
The effectiveness of using these tools directly depends on the experience of the trader. It will be difficult at first, but over time you will get used to it. I can’t guarantee that each of you will be able to predict the movements of the big man, but at least you will be able to see the traps and be able to correctly place stops and takes.
In the comments, you can not only leave questions about working with Level I and II, but also share your own experience. Perhaps there are suggestions or comments - I will also be happy to hear them.
This concludes my short overview of working with the stock order book. Don't forget to subscribe to my blog updates in telegram to be among the first to receive notifications about the release of new materials. All the best, success in trading and see you soon!
If you find an error in the text, please select a piece of text and press Ctrl+Enter. Thanks for helping my blog get better!