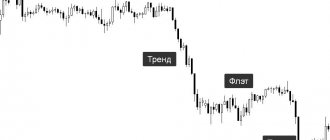
- Trend
- ADX for trend
- Trends and moving averages
- Trends and Bollinger Bands
- Consolidation (sideways price movement)
- Consolidation: ADX
- Consolidation: Bollinger Bands
- Consolidation: Oscillators
- Rollback or reversal?
- Rollback against the trend
- U-turn
- How to spot a reversal
- Reversal: Fibonacci levels
- Pivot: pivot points
- Reversal: trend lines
- Reversal: Price Highs and Lows
- Market price status
When we open the charts, the first thing we need to understand is what’s wrong with the market. What condition is he in? The success of your trading system depends on the answer to this critical question. Because I didn’t come across a magic system that suited all the market conditions. To know which tool and how to use it, you need to understand exactly what market condition it is intended for.
Different market mechanisms operate in trending markets and consolidating markets. Adapting to them is a task that every trader must solve before spending their hard-earned money.
This is why trend lines and channels are used in trending markets, and why support/resistance, pivot points and other tools are so good in sideways movements.
And, strictly speaking, the market has only 3 states:
- trend up;
- trend down;
- consolidation.
There are many ways to determine these market conditions; we will use several that are most accessible to understanding. Including trend lines, ADX indicator, Bollinger bands and moving averages.
What is consolidation or flat?
Consolidation in Forex is a state of the market when it is sandwiched between support and resistance. This condition means that a certain state of balance has arisen in the market between sellers or buyers, that is, demand has balanced supply. In other words, the market is in a state of accumulation or distribution. According to statistics, approximately 80% of the time markets are in a flat state, so trading in a sideways range will always be profitable for traders.
For consolidation to become obvious, the price must touch the support and resistance level at least twice.
Consolidations can expand and contract.
An expanding consolidation occurs when price falsely breaks out and moves back into the range, thereby expanding the space between support and resistance. Selling at resistance will force you to get stopped as the price breaks the current resistance level and then returns to the range again.
A contraction consolidation occurs when the market enters a period of low volatility, usually due to an impending news release.
During periods of narrow consolidation, it is better to refrain from entering the market and making trades. But during periods of broad consolidation, you can trade from its borders. This will give us good risk/reward potential. However, you should always remember that sooner or later the price will go beyond the range, a true breakout of the level will occur, and the market will enter the trend phase.
The longer the market is in a flat, the stronger the trend will be after the price leaves the range. Any calm movement in Forex is replaced by an explosive one, and vice versa.
Other Types of Consolidation: Various Consolidation Patterns
Apart from the rectangle, price consolidation can take any of the following forms:
- Wedges . These are price consolidation patterns in which price bars lie within two trend lines that slope up or down, but one trend line has a greater slope than the other. Because the boundaries will eventually cross each other, price fluctuations within the pattern's boundaries become smaller and smaller over time until price breaks out of any of the structures. There are two types: a rising wedge (when both trend lines are rising) and a falling wedge (when both trend lines are falling).
- Triangles . These are price consolidation patterns that have a triangle shape. There are three types of triangle: ascending triangle, descending triangle and symmetrical triangle. As with the wedge pattern, price fluctuations within the pattern's boundaries continue to decrease until the price moves beyond either boundary. Both patterns are considered continuation patterns, so the likelihood of a price breakout in the direction of the trend preceding the formation of the triangle pattern is higher. However, a breakthrough can also occur in the opposite direction.
- Flags and pennants . These are small patterns of price consolidation that occur after a rapid price movement in the direction of the trend. Both of these are continuation patterns, meaning that the price is likely to continue moving in the direction of the trend. While flags are rectangular patterns sloping up or down, pennants are small triangles. When they occur in an uptrend, they are called bull flags/pennants, and when they occur in a downtrend, they are called bear flags/pennants.
- Double and triple tops/bottoms . Triple top/bottom and double top/bottom patterns are price consolidations that occur after an extended up/down trend. Because they often represent a transition period from one trend to the opposite, these patterns are known as reversal chart patterns. They represent a period of accumulation or distribution, as the case may be, with a triple or double top pattern representing a period of distribution, while a triple or double bottom pattern represents a period of accumulation. Although these patterns are considered reversal consolidation patterns, price can break out in any direction.
Flat is a deposit killer
We have all heard or read on various forums that flat is a killer of trend traders’ deposits. In fact, this is true. If your trading system performs outstandingly in a trending market, then once the sideways movement begins, you can say goodbye to all your profits.
Why does this happen?
The thing is that trend methods will give you signals to enter the market near support and resistance levels, and as soon as you open a buy deal, literally after a couple of points the price hits the level, and after that a reversal begins. On average, the trading system will give 4 false signals, which will completely cover the profits received when trading with the trend. Therefore, if you learn to identify a flat in the early stages of its formation, then the damage caused by it will be minimized, or better yet, you will be able to use this market state to your advantage.
If we try to compare these two market conditions, we will get that the trend is a sprinter, and the flat is an old man whose path from home to the store, and then back, is his favorite.
Market price status
As you can see, using simple techniques, we can develop practical solutions to determine whether the price is reversing or moving further along the trend.
Trends, pullbacks and consolidation are the three pillars of any market. I also advise you to be extremely careful about candlestick combinations in reversal zones, be they trend lines, pivots or other instruments.
Study them. Save screenshots. Search on history. Don't be lazy. This is the only way to learn, over time, to better determine price behavior. At some point, you will feel it on an intuitive level. But this is only a continuation of your trading practice, which, after many months of practice, has moved to a new level.
Experienced drivers do not think about when to squeeze the clutch and when to pull the gearshift knob. Not only that: they even feel the dimensions of the car. It would seem an incredible thing: you are inside, she is outside, and you feel that there are 5 cm left from the bumper to the sidewalk. In trading, you just need to reach a similar level of intuitive perception, based on many hours of theory and practice. Therefore, the specific tool is not so important - your level of proficiency in it is much more relevant.
- Back: Divergence
- Next: Multiframe Analysis
Flat on Forex and its characteristics
Sideways price movement has a certain character, which can be described in several points. It is enough to study them, and you will be one step closer to professionalism in determining current conditions on the charts of various currency pairs. So, let's go!
The flat market is passive
It rarely experiences strong, purposeful movements towards one of its boundaries. This price behavior can be explained by uncertainty. None of the participants knows for sure the direction in which the market will move, because every time one of the borders is touched, there is a potential for its breakdown.
Uncertainty
You already know that nothing on the market is 100% accurate. So, the flat zone is a haven for complete confusion, where at least some probability arises only when the price approaches one of the levels, but you cannot say with sufficient confidence that after that it will reach the opposite zone.
Deceptiveness
Sometimes, thoughts arise that the flat has ended, the range has been broken and the price begins to move in the chosen direction. Unfortunately, it's not that simple. Market makers (big guys) know that many newcomers will open orders in the direction of the broken level, therefore, after the breakout, you can observe a reversal movement and a return entry into the flat zone.
The chart above shows an excellent example of a false breakout of the lower boundary followed by a reversal that ended with a breakout of the upper level. Of course it's a shame! No problem, then we’ll figure out how we need to act in such situations.
Tools
Some indicators can also help track price consolidation:
Figure 3 – Trader in action
- Bollinger Bands;
- ADX (Average Direction of Movement Index);
- ATR (Average True Range).
ADX
The ADX indicator was developed as a trend indicator, but has become one of the most popular tools for identifying consolidation. When the indicator on the indicator scale is 25 or higher, there is a pronounced trend in the market. If the indicator is less than 25, then there is a high probability of consolidation.
Bollinger Bands
Although the Bollinger Bands indicator is a trend indicator, many traders also use it to determine market volatility. It is determined simply: if the upper and lower bands diverge, increasing the price channel, then volatility increases, and vice versa.
During consolidation, the price channel becomes very narrow, and the price going beyond its boundaries is clearly visible. But we must take into account that when consolidation occurs immediately after strong price movements, Bollinger Bands become ineffective - although they converge, they are not fast enough to give a clear signal about the completion of price consolidation and the resumption of its movement.
Read more: What is currency risk hedging and when is it used?
Oscillators
The purpose of oscillators is to identify overbought/oversold zones of an asset and probable trend reversal points.
Figure 4 – Oscillators in trading
During the period of consolidation, the price moves in a narrow channel, and the areas near its outer boundaries become overbought or oversold zones.
When the price touches the upper or lower border, the probability of it reversing in the opposite direction is quite high.
All oscillators work on the same principle, so there is no fundamental difference which one to use in trading.
The most popular ones are Stochastic and RSI (Relative Strength Index).
But the use of oscillators has one feature - they are not able to adjust depending on the market situation. Those. even in a clearly defined trend, they will show overbought and oversold zones, and give out many signals for a price reversal, most of them false in such a situation.
How to determine a flat?
In order to correctly learn to identify a flat, we must remember what it looks like. A sideways movement is a movement between two highs and lows, perhaps this will be enough. Let's look at the chart and try to identify any price fluctuations between the latest highs and lows.
Blue circles mark the first minimum and maximum. As we can see, the subsequent price movement is contained within the range of the boundaries we have drawn. Next, we can observe how the price breaks through the upper level and an upward trend begins, but it is worth noting that the price before this made 4 rebounds from levels that we could use to make a profit.
Now, let's talk about the main thing. We need to go back to the first chart and find out what we should have done in case of a false breakout, because it is very unpleasant to receive losses due to this kind of situation.
There is no point in being offended by market makers, they were, are and will be. We need to learn to think like them, and also to see what they see. Let's look at an example.
So what do we see? The price breaks through the lower border, but we do not consider the breakout to be true until it confirms its status; we sit and wait. Then the market approaches the broken level, and what can we observe? A bullish Pin Bar was formed on the chart, and even with a long tail, this immediately tells us that there is no point in waiting for confirmation, we open a buy deal, the market begins to grow. It's easy if you have patience.
Search for models HH, HL and LH, LL
The first tactic has been used for hundreds of years, and for good reason - it works.
My favorite way to determine if a market is trending is to simply look at price action. It's very simple, I look for repeating patterns of higher highs (HH) and lower lows (HL) in a market in an uptrend, and lower highs (LH) and lower lows (LL) in a downtrend.
Below is an example of a market that is clearly trending lower, as evidenced by lower highs (LH) and lower lows (LL).
Lower highs and lower lows mean a downtrend...
The following chart is an example of a market that is in a clear upside area, as evidenced by a sequence of higher highs (HH) and higher lows (HL).
Higher lows and higher highs mean an upward trend...
Traders often wonder how to find out when a new trend begins and when an old one ends..
The simplest thing is to use the tactics described above, based on looking for higher highs and lows for an uptrend, and lower lows and highs for a downtrend.
For example, you notice that a sequence of higher highs and higher lows has been interrupted by a lower high, an early warning that the trend may be ending.
But in order to begin to consider an uptrend reversal situation, at least one sequence of a lower high and a lower low must occur. This means that when price makes a lower top (failed to make a higher high), you should wait for the formation lower minimum. This is when you should start looking for sales opportunities.
How to trade in a sideways market?
The best strategy for trading sideways markets is a false breakout. It usually provides a powerful impetus for price movement in the opposite direction. Market makers always collect traders' stop losses at levels to gain liquidity and then move in the opposite direction. This should always be taken into account when trading false breakouts. You can set take profit and exit the trade on the other side of the trading range.
If the market is too chaotic, its trading range is jagged, and the price moves too sharply and volatile, it is best to refrain from trading.
Differences between IFRS and RAS
- Various approaches to determining the tax base;
- RAS uses one chart of accounts; IFRS does not have a single chart of accounts;
- And IFRS short-term financial investments and bank overdrafts can be included in operating activities;
- According to IFRS, an organization can present cash flows using the direct or indirect method; RAS provides only the direct method;
- Different approaches to accounting for assets (RAS does not take into account the degree of liquidity of assets);
- According to IFRS, an organization can set its own reporting period;
- The basis for reflecting data in accounting in RAS is primary documentation, in IFRS - professional judgment;
- In IFRS, the financial performance statement contains a larger number of indicators.
How does a breakout of flat boundaries occur?
We have come to the last part of this article. A sideways movement breakout can be predicted by just knowing what to look for on the chart. Let's look at two main methods.
Method “Reversal through a breakout”
This is exactly what we recently broke down in the chart above. The price breaks through the lower boundary, and instead of testing it, it returns to the zone. This market behavior signals us about a potential breakout of the opposite level, and we have a chance to enter the emerging trend at the best prices. You can see what it should look like above.
Incomplete Completion Method
This name refers to the price shortfall to the opposite level. This happens because certain forces (bears or bulls) took control of the market without waiting to touch “their” border. Therefore, as soon as we see that the price has only reached the middle of the flat zone or has traveled only 1/3 of the intended path, we must be ready to open trades in the direction of the reversal. On the graph, it looks like this.
You can see how the price began its decline from the resistance level, but without touching the support, it began a reversal, which led to a breakdown of the upper border. After this, an upward trend emerged.
What do consolidated financial statements look like and what are they?
The preparation of consolidated financial statements is usually carried out by the parent company. The resulting summary report allows investors and managers to see objective and most accurate data. The requirement to prepare a consolidated report is quite justified, since it is impossible to judge the real financial position of a group of enterprises only from the data of the parent company. And, accordingly, to realistically assess the possible profitability of investments.
Consolidated financial statements are prepared in accordance with the requirements of international standards. Such reporting includes the following packages of documents:
- balance sheet;
- data on profits and losses received;
- information about changes that have occurred in equity;
- data on actual and real cash flows.
In addition, the consolidated report contains notes - explanations of the figures in different reports.
Trading on a rebound from the boundaries of the trading range
A rebound from consolidation boundaries is one of the best and most profitable trading setups in the price action system. There are several reasons that make range trading potentially beneficial for a trader. Let's look at the nuances and features of rebound trading.
Possible profit
The great thing about price action trading is the flexibility it offers. Price action can successfully fit into a variety of trading styles and offers many opportunities to customize your trading.
Consolidations can occur on different timeframes - H1, H4, D1. In most ranges you can successfully open at least two trades and even more.
On H4 you can expect to make an average of 40 pips per trade, which over two trades will give you around 80 pips in profit. If a trading range forms on the daily chart, you can gain an average of 80 pips per trade. Thus, by making just 2 trades on the daily chart, you can make more than 160 pips of profit.
The profitability of trading ranges is unmatched. The main thing is to be able to open a deal on time.
Reliability
Consolidations provide ideal profit opportunities because they form between support levels and resistance areas, which are themselves buying and selling zones. Thus, when the price moves up, it enters the sell zone. When the price moves down, it enters the buy zone.
This gives us reliable points to enter the market. Let's look at some examples.
Above you can see a chart of the USD/CAD currency pair, which was in a range. The dotted line on the chart is the psychological level of 1.0000. This range had several trading opportunities that could be taken advantage of.
The reversal trading strategy was described in detail in the article Price Action Strategy for Beginners: Trading Reversal Setups. The basic idea is to find a directional move followed by an uncertainty candle at a support or resistance level.
I highlighted 5 rebounds that formed in the USD/CAD consolidation zone. Of the 5 trades, only the first one was unsuccessful. Since the trading range of the currency pair is 80 points, we can take 60 points of profit in rebound trades.
Trading strategy
You should focus on support zones (places to buy) and resistance zones (places to sell). Once the price reaches these areas, you can look for opportunities to open positions. Once your position is opened, you need to select the other side of the range to achieve your target profit.
If the price reaches your target, you can immediately enter a trade in the opposite direction. Trading consolidations is incredibly easy and requires minimal investment if you do it right.
Determining the range is simple. You just need to find two bounces from the support level and two bounces from the resistance level. When they occur, you will know that the range has been confirmed and you can enter the market.
Theoretically, you can enter at every touch from support or resistance levels, but this will be too dangerous. You will never be able to know when the price will leave the zone and breakout the level. If you are only looking for hopeful trade setups forming in buy or sell zones, pay attention to the price action patterns that should appear at the levels.
Basic methods of consolidating financial statements
Full consolidation
The method is applied to subsidiaries that have undergone acquisition or merger procedures. In this case, all assets of divisions of one structure fall under consolidation. The liability reflects the rights of the “daughters”. A group of companies is perceived as one economic entity carrying out economic activities.
Proportional consolidation
It assumes that the report will only include those financial assets that the parent company of the specified group owns and has the right to manage.
Share
Provides for the reflection in reports of data on investments that were made in associated enterprises. Investments are recorded at par value with goodwill generated.
Business consolidation
In a business context, consolidation refers to the process of combining two or more legal entities into one new entity. In this case, consolidation can occur in several ways:
- Absorption. This is a business combination in which the assets of the acquired company are liquidated, while a larger, more financially sound entity (the “acquirer”) survives.
- Merger. The merger takes place on equal terms; as a result of this process, both companies are liquidated, and on their basis a new company emerges with combined assets.
- Buying shares. A business combination occurs through the acquisition by one company of more than 50% of the shares (controlling stake) of another company. Both firms continue to exist, but the activities of the controlled organization will largely depend on the decisions of the legal entity that owns the controlling stake.
Consolidation in business occurs for various reasons. By combining, organizations can gain access to new technologies, enter new markets, optimize production costs, strengthen their positions among competitors, occupy a monopoly (privileged) position, etc.
Forex consolidation zones indicator
In order not to waste time on identifying and drawing channels on the chart, there is a good indicator of consolidation zones. Its name is Consolidation Breakout .
The Forex indicator, which depicts consolidation in trading, will show the direction of the breakthrough of the price movement, as well as in which places to place Stop Loss orders in order to limit possible losses in time.
On the graph it looks like this:
Figure 4. Consolidation Breakout indicator.