The country's economic indicators clearly demonstrate how efficiently it is developing. How her income grew over a certain period of time. One such indicator is GDP. Experienced economists encounter it all the time. Let's look at what this indicator means and how to calculate it.
History of appearance
In the 30s of the last century, researchers decided to measure the volume of national production. This was the first advance in the study of the country’s economic activity; before that, no one had studied this issue in detail.
The concept of GDP (gross domestic product) was introduced in 1934 in America by economist Simon Kuznets. At that time, it was he who worked in the US Department of Commerce and did the calculations. He recalculated the national income of the United States of America up to 1869.
In the 1930s, it was granted to the US Congress in 1937, and the term “macroeconomics” came into use in mid-1939. But the work received its highest assessment only in 1971, when the author was awarded the Nobel Prize for his research. GDP began to be used as a base indicator in the system of national accounts in the early 90s of the 20th century.
Comparison table of GDP and GNI
| GDP | GNI | |
| Definition | The total cost of all products produced in the country for 1 year, including by foreign enterprises located in the country | Income from products or services received by citizens of a particular country, including from abroad, minus the cost of goods that went to foreign residents |
| In simple words | Total goods and services produced in the country | Income received by citizens of this country |
| The basis | Territoriality | Possession |
| Economy | Country's economic indicator | The state of the economy of the country's citizens |
| Focus | Produced goods and services in a specific country | Income received by citizens of this country |
| What is taken into account | When calculating, foreign enterprises in the territory of this country are taken into account, which invest money in production and then bring it back to their homeland | The indicator of all residents who invest capital in other states and then transfer it back to the state’s economy is taken into account |
Both GDP and GNI reflect how effectively a country's economy is growing year after year. If the GDP is high, then the country has large production volumes, and vice versa. GNI is a measure of the total income received by a country's residents during the year.
This does not take into account:
- Uneven distribution of profits among different groups of the population;
- Shadow economy;
- Volunteering and social activities that are not paid;
- Equal assessment of different products and the degree of their usefulness to society (for example, food and alcohol);
- Time spent on work and rest;
- Damage to the environment, etc.
Therefore, the ratings of different countries from the World Bank (high, medium, low) are not always objective. They are formed based on GDP per capita.
Answers to readers' questions
– What is GDP in Purchasing Power Parity – Purchasing Power Parity (PPP) is similar to exchange rates. Only the basis is not the stock market balance, but the product balance. 1 US dollar can buy one loaf of bread. The same loaf can be bought for 40 rubles. Accordingly, the purchasing power parity for the price of bread is 1 dollar to 40 rubles. And Russia’s GDP at PPP will be converted into dollars not at the official rate, say, 66 rubles, but at 40 rubles, that is, it will be 30% higher than the nominal one. And to avoid distortions, the calculations are based not on just bread, but on a set of several hundred products and services. Accordingly, Russia's GDP according to PPP is always higher than real or nominal GDP, since the ruble is undervalued on the stock exchange.
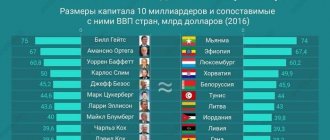
– What is GDP per capita? – The GDP per capita indicator allows you to determine and further monitor the level of well-being of the population. This is GDP divided by the number of inhabitants of the territory (for example, a country or region). According to Rosstat, 146,793,744 people lived in Russia as of January 1, 2022. The country's real GDP, according to the same department, is $1.267 trillion. We divide the second indicator by the first and get: 1267 billion / 146.8 million = 8.63 thousand dollars or approximately 570 thousand rubles. This is 73rd place in the world. For comparison: the leaders are now Luxembourg ($110 thousand), Switzerland ($80 thousand) and Norway ($73.7 thousand). The ranking of countries is greatly influenced by population size and economic structure. In Switzerland there are few people, but there are many banks - hence the high result. And one of the leaders in absolute GDP in the world - China - due to the huge number of inhabitants, is located next to Russia - in the eighth ten countries in terms of GDP per capita.
But in terms of GDP per capita at purchasing power parity, the situation is different. Here, for each Russian there are 25.5 thousand dollars, and this is 53rd place, between Romania and Croatia. The leading positions are held by Qatar, Macau, Luxembourg and Singapore. Such figures indicate that while the level of production and income of citizens in Russia is not the highest, prices for manufactured goods are also low. This makes it possible to ensure a decent global average level of population consumption. Another thing is that this average level is a very conditional indicator, and not the majority of Russians have it.
– Why is GDP calculated either in rubles or in dollars? – Any methodology for calculating GDP allows you to calculate this indicator both in national and in any other currency. For the purposes of domestic planning and statistics in the Russian Federation, the volume of gross domestic product is announced in rubles. For comparison with other countries, as well as for publications in international media and statistical collections, the GDP of the Russian Federation is calculated in dollars at the average exchange rate of the Central Bank of the Russian Federation for the reporting period (year, quarter, month).
– How accurate is the GDP indicator? – The level of gross domestic product is not an exact calculation of the volume of the economy, but an indication of the dynamics of its development. Many economists (including the author of the term, Simon Kuznets) believe that there is no direct relationship between GDP growth and an increase in the welfare of the state, since, for example, taking into account financial flows only from production and sales in GDP gives a one-sided picture of economic development.
Accounting for operations that reduce natural capital (all products that nature provides - minerals, vegetation, wildlife, etc.) as income (a logging company reduces the amount of natural capital by cutting down trees, selling them and receiving income) is actually encourages depletion of natural resources.
The growth of this component of GDP indicates, rather, the prerequisites for a future decline in economic indicators - coal mining is gradually leading to the depletion of deposits and a decline in coal production.
In addition, the calculation of GDP gives a lot of room for manipulation, since the statistical agency, as a rule, reports to the government of the country, which has a direct interest in the growth of gross domestic product. For example, over the past 3 years, the size of Russia's GDP was twice recalculated by Rosstat upward, and both times this recalculation coincided with the pre-election periods. However, there are other opinions.
The Ministry of Economic Development of the Russian Federation, for example, considers real GDP growth of 3% per year a strategic target, since they are confident that upon reaching this indicator, complete economic stability will occur.
The Department of International Capital Markets of the IMEMO RAS explains the discrepancies between some indicators within the framework of GDP by the presence of the shadow sector of the economy. For example, it is difficult to take into account the income of people working for “gray” salaries. When calculating GDP by expenditure or value added, this inaccuracy is relatively leveled out, but others arise - associated, for example, with double counting of the same manufactured products sold twice during the year, and so on.
Despite this, the independent FBK Institute for Strategic Analysis notes that, in general, the calculation of GDP is close to reality and even attempts to “move” it in one direction or another do not make big changes to the overall picture of economic development.
– Where can I find data on a country’s GDP? – Information on Russia’s GDP for previous periods is calculated and published by Rosstat on its website in the “National Accounts” section: Here, in the “Gross Domestic Product” section, data on GDP dynamics since 1996 is posted in current and constant prices, as well as in comparison with previous ones for years.
Information on the GDP of other countries in the original can be obtained on the IMF website in the “Data” section. The World Bank also conducts its calculation of GDP. Its website provides the dynamics of world GDP since 1990, as well as an estimate of the gross domestic product for all countries of the world.
GDP statistics by nominal volume are maintained by the United Nations (UN), their data is located on this website.
Rosstat has been providing information to all these bodies since the late 1980s. Internal statistics in Russia (“system of national accounts”) are also maintained in accordance with the standards of international financial organizations.
Structure of gross domestic product
Every year, Rosstat publishes information on the structure of GDP in Russia by type of activity that affects the gross domestic product.
Based on the results for 6 months of 2022, the following industries had the best impact on the country’s GDP:
- oil and fossils,
- trade,
- banking activity,
- taxes and fees,
- transport,
- construction,
- storage facilities,
- telecom operators,
- forestry and fisheries,
- paid medicine,
- hotel service,
- public catering,
- waste collection and separation,
- And so on.
You can understand changes in the structure of GDP by looking at production by industry. Some areas of activity are developing, others are in crisis. For example, according to Roskomstat data for 2022, beverage production for 6 months of this year became 100.3% compared to the same period last year - 100.1%.
GDP indicators by country for 2022
Gross Domestic Product by Country
| Place | A country | GDP volume ($ million) |
| 1 | USA | 20 494 100.00 |
| 2 | China | 13 608 151.86 |
| 3 | Japan | 4 970 915.56 |
| 4 | Germany | 3 996 759.29 |
| 5 | Great Britain | 2 825 207.95 |
| 6 | France | 2 777 535.24 |
| 7 | India | 2 726 322.62 |
| 8 | Italy | 2 073 901.99 |
| 9 | Brazil | 1 868 626.09 |
| 10 | Canada | 1 712 510.03 |
| 11 | Russia | 1 657 553.77 |
| World GDP | 85 804 390.60 |
Gross domestic product of countries at PPP 2016 - 2022
| Place | A country | GDP ($ million) in 2016 | GDP ($ million) in 2022 | GDP ($ million) in 2022 |
| 1 | China | 21 387 606.58 | 23 266 768.93 | 25 398 678.00 |
| 2 | USA | 18 707 188.23 | 19 485 393.85 | 20 544 343.46 |
| 3 | India | 8 787 915.26 | 9 596 835.13 | 10 500 208.40 |
| 4 | Japan | 5 221 770.21 | 5 319 800.46 | 5 415 123.91 |
| 5 | Germany | 4 077 583.50 | 4 302 735.86 | 4 401 361.32 |
| 6 | Russia | 3 530 790.32 | 3 783 634.64 | 4 050 785.54 |
| 7 | Indonesia | 3 035 212.62 | 3 249 635.34 | 3 500 935.83 |
| 8 | Brazil | 3 160 798.93 | 3 255,143.44 | 3 371 702.37 |
| 9 | Great Britain | 2 856 266.25 | 2 997 684.81 | 3 056 736.51 |
| 10 | France | 2 811 271.87 | 2 959 179.91 | 3 037 362.13 |
Types of GDP
It is customary to distinguish between nominal and real GDP. Nominal GDP refers to the total value of all final goods and services in a country. It is taken into account even if a plant of a resident of another state operates and produces goods on the territory of one country. Therefore, it rises and falls depending on the price of goods and services.
Real GDP is the value of all goods and services that was formed once. It can be expressed in prices of any year. This indicator is influenced by the following factors: the number of employees, the amount of capital investment, time spent, etc. It indicates how many products are produced in a particular country.
You can compare the economic performance of different countries using purchasing value parity (PPP). This tool assumes that prices of similar goods or services in different countries should be approximately the same.
World GDP
In the press you can find various indicators of world GDP. The reason is that gross domestic product at par and at PPP are very different. In 2022, this figure in PPP terms amounted to $138.352 billion. If we consider this figure in terms of nominal GDP, it will be $87.265 billion.
In more developed countries, one can notice a lead in GDP and a lag in PPP. Gross domestic product according to PPP may be in good positions, but if at the same time there is a depreciation of the national currency, then GDP at par will fall. On the Internet, we mainly find GDP indicators based on PPP.
Data sources
The World Bank has one of the best and most comprehensive lists of countries for which it tracks GDP data. The International Monetary Fund (IMF) also provides data on gross domestic product through its numerous databases, such as the World Economic Outlook and International Financial Statistics.
Another source of GDP data is the Organization for Economic Co-operation and Development (OECD). The Organization for Economic Co-operation and Development provides not only historical data, but also GDP growth forecasts. The disadvantage of using the OECD database is that it only tracks OECD countries and a few non-OECD countries.
In the US, the Federal Reserve collects data from several sources, including the country's statistical agencies and the World Bank. The only downside to using the Federal Reserve database is the lack of updating of GDP data and the lack of data for individual countries.
The Bureau of Economic Analysis (BEA), a division of the U.S. Department of Commerce, publishes its own policy paper with each GDP release, which is an excellent tool for analyzing the highlights of the full release.
What is not reflected in GDP
When calculating GDP, only production-related income is taken into account. Not reflected:
- transactions with securities,
- gifts and gratuitous financial assistance;
- state benefits, scholarships, pensions, subsidies,
- sale of second hand goods.
Also, the increase in the value of assets and products produced in the previous period are not taken into account.
The shadow economy is reflected when calculating GDP, but this figure is approximate, it is estimated to be 12-20% of Russia's GDP.
What affects GDP
The higher the GDP, the better life in the country due to the availability of jobs, wages and the availability of necessary goods and services. The main factors for the growth of gross domestic product:
- Involvement of additional resources (increase in the country’s working age citizens);
- Introduction of innovative technologies (modern software) into the production process;
- Scientific and technological progress in plants and factories (new machines, robotization);
- Improving the qualifications of specialists (as a result, improving the quality of work).
GDP growth is also affected by investments, physical and human capital, and consumer spending.
data usage
Most countries publish monthly and quarterly GDP data. In the US, the Bureau of Economic Analysis (BEA) releases the preliminary quarterly GDP report four weeks after the end of the quarter and the final release three months after the end of the quarter. BEA releases are comprehensive and contain a wealth of detail that allows economists and investors to obtain information on various aspects of the economy.
The impact of GDP on the market is typically limited because a significant amount of time has already passed between the end of the quarter and the release of GDP data. However, GDP data can have an impact on markets if actual numbers differ significantly from expectations.
Because gross domestic product is a direct indicator of the health and growth of an economy, businesses can use it to guide their business strategy. Government agencies, such as central banks, use growth rates and other measures of gross domestic product in the process of deciding what type of monetary policy to implement. If growth slows, they may pursue expansionary monetary policy to try to stimulate the economy. If growth is sustained, they may use monetary policy to slow inflation.
Real GDP is the metric that tells the most about the health of an economy. It is widely used and discussed by economists, analysts, investors and policy makers. The pre-release of the latest data will almost always have an impact on the markets, although the impact may be limited.
How to calculate GDP
There are different ways to calculate Russia's gross domestic product:
- The production method involves the pooling of value added. The calculation evaluates the production market in Russia.
- The source of expenditure method calculates the total number of expenditures for all sectors of the economy, including exports.
- The method of formation by source of income includes the calculation of income received by government bodies. Since it is impossible to calculate all incomes, this method is used in combination with other methods of calculating GDP.
The basic formula for calculating GDP looks like this:
expenses for the purchase of goods/services + gross investment + government spending + (exports - imports).
GDP is measured using a formula once a quarter or a year. Based on these indicators, the Central Bank and Roskomstat put forward growth forecasts.
The calculations do not take into account:
- Self-employed work, for example, building a house or a bathhouse;
- Free assistance (volunteering);
- Transactions with securities;
- Expenses and income of the shadow economy.
Comparative table of methods for calculating GDP
| Industrial method | Cost calculation | Calculation by income | |
| Includes | VA – added value for all goods manufactured in the country (this does not include the market price of products that were used in the manufacture of the final product, for example, the cost of fabric for sewing a dress is not taken into account, only VAT on the dress itself is taken into account); NPI – production and import tax; C – subsidies. | C – consumer expenses, purchases of joint and personal products by firms, and government expenses for maintaining budgetary enterprises; I – investments; G – government expenditures; X is the difference between goods imported into the country and goods exported from the country (net exports). | ZP – employee wages; P is the rental price; P – capitalization of bank deposits; KS – indirect tax; A – depreciation; NFI – foreign net factor income. |
| Formula | GDP = DS + NPI - C | GDP = C + I + G + Xn | GDP = ZP + P + P + VD + KS + A – NFD |
What indicators are calculated along with GDP
GDP cannot give an objective assessment of the real situation of the economy in the state. Therefore, analysts take into account other indicators that allow them to understand how well the population lives.
Together with GDP the following is calculated:
- CPI: consumer price index (determines the level of inflation, used for analytics and price forecasting);
- GNP: gross national product (includes the total value of all securities on the country's market);
- NNP: net national product (this indicator is obtained by deducting from GDP the costs of subsidizing certain companies, for example, when production is depleted);
- actual GDP (takes into account the possibility of underemployment in combination with realized economic indicators);
- potential GDP (forecast of GDP with full employment and realized production capabilities);
- The GDP deflator shows the difference between the prices of the current and last (or base) year.
How to increase GDP
If you influence the indicators that are used to calculate GDP, you can increase the gross domestic product itself. How to do this, see the table.
| Way to increase GDP | More details | Result |
| Increase in the number of employees | Fight against unemployment Employment service work Increased birth rate Decrease in mortality | The larger the working population, the more products are produced |
| Improving the quality of life of the population | Affordable education Improvement of employee qualifications | Well-educated workers invent and produce higher quality products, hence increasing value added |
| Bringing the illegal economy out of the shadows | Eliminate salaries in envelopes | Added value increases |
| Reduced production costs | Equipment modernization | Increased productivity, increased added value |
| Reduced social benefits | Invest money for unemployment benefits into creating new jobs | More products are produced |
Summarizing
In their textbook Economics, Paul Samuelson and William Nordhaus clearly outline the importance of a country's GDP. They compare the ability of gross domestic product to provide an overall picture of the state of the economy with the ability of a satellite in space to monitor the weather across an entire continent.
Gross domestic product allows policymakers and central banks to judge whether the economy is contracting or expanding, and whether it needs stimulation or containment. Like any measure, gross domestic product has its shortcomings. In recent decades, governments have created various calculation methodologies in an attempt to improve the accuracy of GDP.
Methods for calculating GDP have continuously evolved since its inception to keep pace with the ever-changing rates of industrial activity and the production and consumption of new, emerging forms of intangible assets.
GDP in Russia and other countries
Comparative table of GDP per capita for 6 months of 2021
| A country | GDP per capita in $ |
| Qatar | 140000 |
| Luxembourg | 91048 |
| Kuwait | 82044 |
| Switzerland | 56940 |
| USA | 54969 |
| Germany | 45616 |
| Russia | 25636 |
GDP per capita for Russia in dynamics
| Year | GDP per capita in $ |
| 2015 | 8447 |
| 2016 | 8058 |
| 2017 | 10805 |
| 2018 | 11614 |
| 2019 | 11825 |
| 2020 | 10023 |
| 2021 (for 9 months) | 10446 |
Dynamics
Dynamics – changes in indicators over time for a specific period. More often, the initial values are compared with the indicators for the same period of the previous year. Then it turns out that the comparison is carried out according to the following points:
- Expenses related to finishing costs.
- Agricultural industries.
- State administration.
- Gross fixed capital formation.
- Working capital reserves.
- Import.
- Export.
Dynamics are often depicted using familiar forms of graphs or tables. In this form, it is much easier to take into account all the nuances of GDP, its changes in Russia in different periods, years, months, quarters.
GDP forecast for 2021-2022
According to the Bank of Russia, the GDP forecast for 2021-2022 has been increased to 4.3% (compared to the previous forecast). Further, analysts predict a slowdown in growth rates. They estimate the potential long-term rate to be 2.0%.
The Ministry of Economic Development has published data on the forecast for GDP growth for 2022–2024. According to them, next year growth will slow down slightly and will grow by about 3%. The Ministry of Economic Development claims that this is enough for the state to achieve national development goals.
FAQ
When did GDP appear in Russia and is there data for the 20th century?
The transition to a market economy in Russia took place in 1991. In the USSR there was a similar indicator “Total Social Product”, but the calculations were carried out somewhat differently and not entirely correctly. Some economists are trying to calculate GDP for the USSR, but these calculations are very approximate.
Can the government influence the rate of GDP growth?
There are many ways the state can influence the dynamics of the gross domestic product, but none of them provides a universal solution to the problem.
The most popular and effective methods: increasing state budget expenditures and increasing the money supply. This is done to increase aggregate demand. Both of them have quite serious drawbacks.
As spending increases, government debt is likely to rise and lead to inflation. With an increase in the money supply, it is necessary to have free resources, otherwise the country will inevitably lead to rising prices.
Is the standard of living of citizens determined by the country's GDP?
The standard of living of the population in a country cannot be determined by GDP. This indicator in no way relates to the well-being of specific citizens. Gross domestic product is an indicator of the economic activity of citizens.
Do floods and landslides reduce GDP by the amount of damage?
Natural disasters do not affect GDP in any way. When calculating, only those events that provide profit to the state are taken into account. No financial losses are taken into account.
Connection with financial markets
Publications of the GDP indicator in the country's economy cause a rather serious reaction in the financial markets. The schedule can be viewed in economic calendars; they are always marked as very important. The United States deserves special attention, because it is they who often set the tone in the global economy. A slowdown in their performance can cause a chain reaction and a general flight from risky assets, while strong growth usually gives a positive outlook and markets rise. It can be considered in the following aspects:
- Currency market. Usually a good publication causes a country's currency to rise. Bad - fall. With data consistent with forecasts, there is usually a short-term increase in volatility and then everything returns to normal.
- Stock market. But here everything is much more serious, since the securities market is directly tied to the real economy. Even the most well-founded positive moves can always reverse sharply once it becomes apparent that the economy is slowing. Everything is taken into account here - inflation, industrial production and the most important parameter - gross domestic product. GDP, in simple words, is the main indicator of the state of the economy, so it is very important for investors.
- Defensive assets . Everything is exactly the opposite. Bad data causes defensive assets to grow, good data causes a fall, that is, there is an inverse correlation with the stock market. Usually there are no strong movements, but this applies to a greater extent to safe-haven currencies, but gold can react quite strongly. If there is a consistent slowdown in GDP in the economy, that is, from quarter to quarter, then panic sentiment may intensify and then the demand for protective assets grows.
As you might guess, the monetary policy of the country’s central bank can also have a significant impact on GDP. When money becomes “cheap”, rapid growth in production activity begins, many companies expand, turnover increases, in general, positive dynamics are observed and this usually has a very strong impact on the final value of GDP in the country’s economy, which is quite natural. Tightening the Central Bank's policy usually leads to the opposite effect.