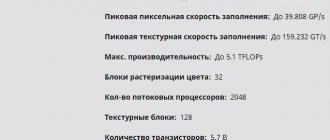
Profitability of NVIDIA GTX 1660 SUPER
The current market price and mining profitability of the NVIDIA GTX 1660 SUPER graphics card fluctuates depending on the value of the cryptocurrency. The information in the plate is updated once a day.
View the full graphics card profitability table with the ability to sort by price, revenue, and ROI.
| Price | ETH | ETC | EXP | UBQ | RVN | BEAM | Profit | Payback |
| 71334.66 ₽ | 30.2 Mh/s | 30.2 Mh/s | 30.2 Mh/s | 30.2 Mh/s | 11.7 Mh/s | 12.2 H/s | 108.76 ₽ 3371.56 ₽ | 655 days |
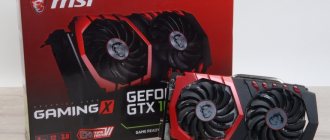
Packaging and equipment
In the general trends of most manufacturers, the box is noticeably larger than the size of the video card itself, at least vertically. Dimensions - 28.5 x 18.2 x 7.3 cm.
The design is bright, in the usual style of the MSI Gaming series. The main emphasis is placed on the lighting system and the efficient cooling system of Twin Frozr 7.
Beneath the thin cardboard outer box is a pull-out cardboard tray with a foam bed that protects the graphics card during transit.
There is no complete set as such. There is nothing except the usual MSI envelope with a minimal set of documentation.
Hashrate NVIDIA GTX 1660 SUPER
We have compiled a table of NVIDIA GTX 1660 SUPER hashrates for popular algorithms. If you are just choosing a video card for mining, and already know what coin you will mine, then you can estimate the approximate performance from the table. We also have an article about what hashrate is.
| Coin | Algorithm | Hashrate |
| Ethereum (ETH) | DaggerHashimoto ETH | 30.2 MH/S |
| Expanse (EXP) | DaggerHashimoto EXP | 30.2 MH/S |
| Ubiq (UBQ) | Ubqhash | 30.2 MH/S |
| Monero (XMR) | RandomX | 505.0 H/S |
| Ravencoin (RVN) | KawPow | 11.7MH/S |
| Beam (BEAM) | BeamHashIII | 12.2 H/S |
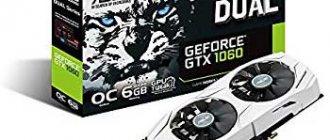
Appearance and Design
The video card looks nice. The stylish dark gray casing with ARGB lighting and fans decorated with MSI dragons, as well as a decorative plate on the back, will fit perfectly into modern gaming builds with an open view of the components.
The video card uses a dual-fan cooling system with a radiator elongated relative to the printed circuit board, so the total measured length is approximately 247 mm.
The backplate plays a decorative role and does not participate in heat dissipation. The surface is stylized to resemble the texture of a processed aluminum plate, which helps reduce the visibility of dust on it. A sticker with the model and serial number of the device is carefully glued in the corner next to the cutout that reveals the PCB model - 1V375-2.2.
The height of the cooling system is relatively small - two standard expansion slots.
The side of the plastic casing is decorated with a controllable backlight module and a dark gray GEFORCE GTX inscription.
The interface bar has four connectors for connecting image output devices: three DisplayPort 1.4 and one HDMI 2.0b. However, according to the specification, only three monitors can be connected simultaneously.
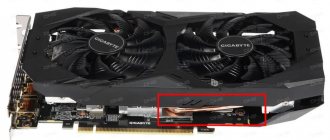
According to information from the manufacturer, the consumption of the video card is 125 W, so one additional eight-pin PCIe power connector is made. This solution is redundant; a six-pin connector would be sufficient.
Overclocking NVIDIA GTX 1660 SUPER for mining
We will overclock the NVIDIA GTX 1660 SUPER for mining using the MSI Afterburner program. You can find it in Yandex. The program interface is very simple, although a little colorful) To overclock the video card, we need two sliders:
- Core Clock – core overclocking, increases the core frequency;
- Memory Clock – memory overclocking, increases the memory frequency.
MSI Afterburner - overclocking video cards
You need to change the frequency values a little at a time. Then test stability. If everything is good, then we increase the frequency further. If the video card starts to fail or the drivers crash, then we simply reduce the frequency and that’s it. There will be no harm. Next, we will look at overclocking options for popular alogorites.
Overclocking NVIDIA GTX 1660 SUPER for Ether
To overclock the NVIDIA GTX 1660 SUPER for mining ether or other coins using the DaggerHashimoto algorithm, you need to increase the memory frequency, and, on the contrary, lower the core to save energy because it does not affect production speed. Optimal overclocking parameters:
| Parameter | Meaning |
| Core Clock | We don't change |
| Memory Clock | +1000 MHz |
| Power Limit | 76% |
| Temp. Limit | 70° |
In progress
In rest mode, the video card does not stop the cooling fans. By default they rotate at a speed of about 1000 rpm.
The level of noise emitted is minimal; they are unlikely to be heard in a closed case. Taking into account active cooling, the GPU temperature at idle barely exceeds 30C.
Under gaming load on an open bench, the GPU warmed up to only 65C. At the same time, the fan rotation speed at peak increased up to 2000 rpm.
According to the given algorithm, the fan rotation speed increases to 76% of the maximum when the chip temperature reaches 63C. In our opinion, the efficiency of the cooler used is enough to reduce the speed without consequences, without fear of overheating the GPU.
To do this, you can use the same Thunder Master utility, where you can manually set a graph of the dependence of fan speed on processor temperature. If you wish, you can experiment here. The final numbers will depend on the conditions of use of the video card. It would be logical to choose an algorithm in which the GPU will not heat up above 70–75C. Here the results will depend on the general cooling conditions of the components inside the case. Again, on an open bench at a maximum of ~1600 rpm, the GPU temperature rose to 70–72C.
Thanks to the work of dynamic auto-overclocking GPU Boost, the graphics processor was accelerated to 1965 MHz under load. On average, operating frequencies were still lower - 1880–1920 MHz.
Backlight
Several zones are highlighted on the fan casing: four thin stripes along the edges of the fans, the bottom two of which will be clearly visible only when the video card is installed vertically, and a block with a logo on the side, clearly visible in a standard horizontal position.
Control and synchronization with other components is carried out through proprietary MSI Dragon Center software.
⇡#Test stand, testing methodology
| Test bench | |
| CPU | Intel Core i9-9900K (4.9 GHz, 4.8 GHz AVX, fixed frequency) |
| Motherboard | ASUS MAXIMUS XI APEX |
| RAM | G.Skill Trident Z RGB F4-3200C14D-16GTZR, 2 x 8 GB (3200 MHz, CL14) |
| ROM | Intel SSD 760p, 1024 GB |
| power unit | Corsair AX1200i, 1200 W |
| CPU cooling system | Corsair Hydro Series H115i |
| Frame | CoolerMaster Test Bench V1.0 |
| Monitor | NEC EA244UHD |
| operating system | Windows 10 Pro x64 |
| Software for AMD GPUs | |
| All video cards | AMD Radeon Software Adrenalin 2022 Edition 19.10.2 |
| NVIDIA GPU software | |
| All video cards | NVIDIA GeForce Game Ready Driver 441.08 |
| Synthetic 3D graphics tests | |||
| Test | API | Permission | Full screen anti-aliasing |
| 3DMark Fire Strike 1.1 | DirectX 11 (feature level 11_0) | 1920 × 1080 | Off |
| 3DMark Fire Strike 1.1 Extreme | 2560 × 1440 | ||
| 3DMark Fire Strike 1.1 Ultra | 3840 × 2160 | ||
| 3DMark Time Spy 1.1 | DirectX 12 (feature level 11_0) | 2560 × 1440 | |
| 3DMark Time Spy Extreme 1.1 | 3840 × 2160 | ||
| Game tests | ||||
| Game (in order of release date) | API | Settings, testing method | Full screen anti-aliasing | |
| 1920 × 1080 / 2560 × 1440 | 3840 × 2160 | |||
| Grand Theft Auto V | DirectX 11 | Built-in benchmark. Max. graphics quality | MSAA 4x + FXAA + Reflection MSAA 4x | FXAA |
| Ashes of the Singularity: Escalation | Vulkan | Built-in benchmark. Max. graphics quality | MSAA 4x + TAA Ultra | Off |
| Far Cry 5 | DirectX 11 | Built-in benchmark. Max. graphics quality | TAA | TAA |
| Strange Brigade | Vulkan | Built-in benchmark. Max. graphics quality | AA Ultra | AA Ultra |
| Shadow of the Tomb Raider | DirectX 12 | Built-in benchmark. Max. graphics quality | SMAA 4x | SMAAT 2x |
| Forza Horizon 4 | DirectX 12 | Built-in benchmark. Max. graphics quality | MSAA 4x + FXAA | FXAA |
| Assassin's Creed Odyssey | DirectX 11 | Built-in benchmark. Max. graphics quality | AA High (TAA) | AA High (TAA) |
| Battlefield V | DirectX 12 | OCAT, Liberte mission. Max. graphics quality. DXR off, DLSS off | TAA High | TAA High |
| Metro Exodus | DirectX 12 | Built-in benchmark. Max. graphics quality. DXR off, DLSS off, Shading Rate 100% | TAA | TAA |
| DiRT Rally 2.0 | DirectX 11 | Built-in benchmark. Max. graphics quality | MSAA 4x + TAA | TAA |
| Tom Clancy's The Division 2 | DirectX 12 | Built-in benchmark. Max. graphics quality | AA Ultra (TAA) | AA Ultra (TAA) |
| Total War: THREE KINGDOMS | DirectX 12 | Built-in benchmark (Battle Benchmark). Max. graphics quality | TAA | TAA |
In most test games, the average and minimum frame rates are derived from an array of individual frame rendering times, which is recorded by the built-in benchmark (or the OCAT utility, if it does not exist).
The average frame rate in the charts is the inverse of the average frame time. To estimate the minimum frame rate, the number of frames formed in each second of the test is calculated. From this array of numbers, the value corresponding to the 1st percentile of the distribution is selected.
Exceptions to this methodology are three games with a built-in benchmark - DiRT Rally 2.0, Far Cry 5 and Forza Horizon 4. The Far Cry 5 benchmark itself records the number of frames per second of the test in a file - the average FPS value and the 1st percentile are calculated based on from these numbers, and not by the rendering time of individual frames. The DiRT Rally 2.0 benchmark only records the average frame rate and the minimum frame rate calculated from the maximum frame time. Forza Horizon 4 does not output any performance parameters to a file and also reports average and minimum frame rate totals.
| General purpose computing, video encoding/decoding | |||
| Program | Settings | ||
| AMD | NVIDIA | ||
| Adobe Premiere Pro CC 2022 (Puget Systems Adobe Premiere Pro CC Benchmark) | 4K Heavy GPU Effects, Live Playback (ProRes 422 59.94 FPS) | OpenCL | CUDA |
| 4K Heavy GPU Effects, export to H.264 40 Mbps UHD and ProRes 422HQ UHD (59.94 FPS) | |||
| Blender 2.8 Beta (Cycles) | Classroom Demo | — | |
| CompuBench 2.0 | Ocean Surface Simulation | OpenCL | CUDA |
| N-Body Simulation 1024K | |||
| DXVA Checker 4.1.2, Decode Benchmark | H.264 | 1920 × 1080 (High Profile, L4.1), 3840 × 2160 (High Profile, L5.1). Microsoft H264 Video Decoder | |
| H.265 | 1920 × 1080 (Main Profile, L4.0), 3840 × 2160 (Main Profile, L5.0), 7680 × 4320 (Main Profile, L6.0). Microsoft HEVC Video Extensions | ||
| VP9 | 1920×1080, 3840×2160, 7680×4320. Microsoft VP9 Video Extensions | ||
| FFmpeg 4.0.2, H.264 encoding | 1920 × 1080 | -c:v h264_amf -quality speed -coder cabac -level 4.1 -refs 1 -b:v 3M | -c:v h264_nvenc -preset fast -coder cabac -level 4.1 -refs 1 -b:v 3M |
| 3840 × 2160 | -c:v h264_amf -quality speed -coder cabac -level 5.1 -refs 1 -b:v 7.5M | -c:v h264_nvenc -preset fast -coder cabac -level 5.1 -refs 1 -b:v 7.5M | |
| FFmpeg 4.0.2, H.265 encoding | 1920 × 1080 | -c:v hevc_amf -quality speed -level 4 -b:v 3M | -c:v hevc_nvenc -preset fast -level 4 -b:v 3M |
| 3840 × 2160 | -c:v hevc_amf -quality speed -level 5 -b:v 7.5M | -c:v hevc_nvenc -preset fast -level 5 -b:v 7.5M | |
| 7680 × 4320 | — | -c:v hevc_nvenc -preset fast -level 6 -refs 1 -b:v 20M | |
| LuxMark 3.1 | Hotel Lobby (Complex Benchmark) | — | |
| SiSoftware Sandra Titanium (2018) SP3b | GPGPU Processing (FP16/FP32/FP64) | OpenCL | CUDA |
| GPGPU Scientific Analysis (FP16/FP32/FP64) | |||
The power of video cards is recorded separately from the CPU and other PC components using a JUNTEK VAT-1050 ammeter. To simultaneously measure the current flowing through the additional power connectors and the motherboard slot, the video card is connected through a PCI Express x16 rigid riser, in which the power lines are broken and routed to a separate cable.
The test load for power and noise level tests is Crysis 3 at a resolution of 3840 × 2160 without full-screen anti-aliasing and maximum graphics quality settings, as well as the FurMark stress test with the most aggressive settings (resolution 3840 × 2160, MSAA 8x). All parameters are measured after the video card has warmed up, when the GPU temperature and clock frequencies stabilize.