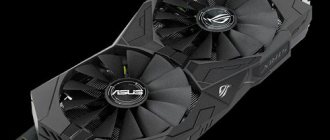
Technologies do not stand still. Moore's Law, which has already undergone fluctuations in the processor market, has been “forcing” chip manufacturers to increase the number of transistors by 1 mm2 for a long time. Transitions to new technical processes, in addition to increasing productivity, also contributed to a reduction in consumption, which had a positive effect on heat dissipation requirements. And, if the use of High Bandwidth Memory (HBM) in video cards of the Fiji generation contributed to the emergence of the compact AMD Radeon R9 NANO, then the transition to 16 nm allowed the emergence of powerful compact video cards without the disadvantages of the R9 NANO - too limited consumption and only 4 GB of on-board memory. Our editors just got such a video card - MSI GeForce GTX 1070 AERO ITX 8G OC. Combining high GPU power and compact size, will it surprise or disappoint us?
Packaging and equipment
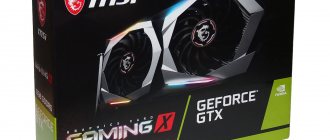
MSI GeForce GTX 1070 AERO ITX 8G OC graphics card comes in a miniature cardboard box. Honestly, if they had told us earlier that this box contained a powerful video card, we would not have believed it.
On the front of the box, made in black and green tones, is the name of the video card. The OC Edition footnote in the lower left corner hints that the graphics card's frequencies have been increased compared to the standard version.
The reverse side of the box focuses on the cooling system of the video card. Also here are the minimum system requirements and technologies that the video card has.
The entire package is limited to paper documentation and a disk with software. Modest, but no longer surprising.
Proprietary software
MSI pays attention not only to the hardware part of the product, but also includes good and very useful software with its products. One such program is MSI Gaming App.
Here you can select one of the video card operating modes, adjust the backlight, enable different screen modes, and enable additional information in games. For example, show the number of frames per second, card loading or its frequency, as the MSI Afterburner program does, only in a simpler and more convenient form.
Graphics card design
MSI GeForce GTX 1070 AERO ITX 8G OC video card is striking at first glance - it’s hard to imagine that under such a miniature cooling system there is a powerful GP104 graphics processor.
One has only to realize that the length of our model does not exceed 175 mm. This is on average 10 cm less than conventional video cards of this class.
The reverse side of the device is replete with elements. The size limitation led to a complicated layout, but MSI engineers dealt with it. On the other hand, the presence of a back plate with thermal pads under it would have a positive effect on the temperature, enhance the appearance, and protect the video card from damage during installation. We don't think this would greatly affect its price.
This is where the sticker with the video card model and its serial number is located.
Mini-ITX cases often limit the thickness of video cards. Therefore, the MSI GeForce GTX 1070 AERO ITX 8G OC comes in a dual-slot design.
There is an MSI inscription on the casing, there is no backlight. And who needs it with a miniature layout?
On the reverse side you can see nickel-plated tubes and thermal pads on the memory chips.
The interface panel has two video outputs HDMI 2.0 and DisplayPort 1.4, as well as one Dual Link DVI-D. The panel itself is well perforated, which is rather a necessity for such a miniature card.
Cooling system and circuit board
When dismantling the cooling system, you need to take into account the fact that a warranty seal is installed on one screw. And, despite the fact that MSI itself does not consider breaking the seal to be a reason for voiding the warranty, and the absence of a back plate allows you to easily unscrew the screw with the seal without breaking the seal, there is no point in carrying out this operation - the factory thermal interface is applied well, its consistency is reminiscent of Arctic MX -4 and its replacement did not bring us any gain in temperature.
In total, you need to unscrew 6 screws: 4 around the GPU and 2 in the area of the power subsystem.
Printed circuit board
The printed circuit board of the MSI GeForce GTX 1070 AERO ITX 8G OC is MSI's own design. It is noted that high-quality components MILITARY CLASS 4 are used in production.
The change in format also led to changes in the layout: the graphics processor and memory chips were rotated 90°, and the power subsystem was moved to the interface panel.
At the heart of the video card is the GP-104-200-A1 graphics processor, manufactured in the 47th week of 2016 (end of November) in Taiwan. Around there are 8 GDDR5 memory chips manufactured by Micron with the marking 6VA47-D9TCB.
The power subsystem is made according to the 5+1 system: five phases are responsible for powering the graphics processor, one for the memory chip. The P9511P PWM controller produced by uPISemiconductor is responsible for voltage control. This fact is encouraging - it provides us with both unlocked voltage control (up to 1.093 V) and compatibility with numerous third-party BIOSes. Together with one 8-pin additional power connector, this is a chance to get video cards.
Cooling system
The cooling system, after unscrewing 6 screws, is secured with only one connector intended for connecting a fan.
The large nickel-plated base removes heat from the GPU and memory chips. A plate is soldered onto the radiator to help cool the power circuits. The imprint on the thermal pads shows that the pressure is tight.
Many aluminum fins located along the card are pierced by three heat pipes, two of which are 8 mm in diameter, one is 6 mm.
The radiator itself has a somewhat specific shape.
According to the manufacturer, Airflow Control technology changes the direction of air flow as needed, ensuring maximum cooling of the GPU.
An MSI TORX fan labeled Power Logic PLD10010S12HH (12 V, 0.4 A) with a diameter of 100 mm is mounted on the video card casing.
Dispersive fan blades help create more airflow without affecting the noise level. Another good thing is that similar fans are installed on Gaming series video cards, which will improve BIOS compatibility.
Technical characteristics and features of the video card
| Name | Nvidia GeForce GTX 1070 | MSI GeForce GTX 1070 AERO ITX 8G OC |
| GPU | GP104-200-A1 | GP104-200-A1 |
| Technical process | 16 nm | 16 nm |
| Kernel size | 314 mm2 | 314 mm2 |
| Base clock speed | 1506 MHz | 1531MHz |
| Boost clock speed | 1683 MHz | 1721 MHz |
| Number of CUDA cores | 1920 | 1920 |
| Number of texture blocks | 120 | 120 |
| Number of rasterization blocks | 64 | 64 |
| Memory type | GDDR5 | GDDR5 |
| Memory performance | 8 Gbps | 8 Gbps |
| Memory | 8 GB | 8 GB |
| Memory bus bandwidth | 256 bit | 256 bit |
| Additional power connectors | 8 | 8 |
| Power consumption | 150 W | 150 W |
| Dimensions (LxHxW) | 267x111x40 mm | 175 x 129 x 40 mm |
| Video outputs | Dual Link DVI-D (1 pc), DP 1.4 (3 pcs), HDMI 2.0b (1 pc) | Dual Link DVI-D (1 pc), DP 1.4 (2 pcs), HDMI 2.0b (2 pcs) |
The MSI GeForce GTX 1070 AERO ITX 8G OC differences in technical characteristics from the GeForce GTX 1070 in the reference version . With the help of TechPowerUp GPU-Z 2.2.0 we will learn about some of them:
In the preinstalled BIOS version 86.04.50.40.0A, the base frequency was increased by 25 MHz from the reference frequency, and the boost frequency by 38 MHz. The memory frequency remained unchanged.
But there was a fly in the ointment. The manufacturer, taking into account the dimensions of the video card and its purpose (installation in compact cases), left the consumption limits modest - 151 W, expandable to 170 W.
Our experience shows that the GP104-200-A1 GPU will not be able to reach such strict limits in some scenarios, which will limit overclocking and performance. On the one hand, for a video card with additional 8-pin power supply, the consumption limits can be safely increased to 225 W (75 W - PCI-E slot, 150 W - 8-pin), on the other hand, this would increase the consumption and heating of the video card, which compact housing is unacceptable.
Despite the size of the cooling system and the presence of only one fan, the MSI GeForce GTX 1070 AERO ITX 8G OC has the ZERO FROZR function. Up to ~50°C (in our case, up to 55°C), the fan of the video card cooling system is stopped.
When idle, the GPU frequency drops to 139 MHz, the memory to 202 MHz (808 MHz effective).
The frequency and voltage correspondence graph at a temperature of 30-40°C is as follows:
As we can see, under normal conditions (without exceeding consumption limits), the graphics processor can reach 1936 MHz with a subsequent decrease in frequency as the temperature rises. The render load in the TechPowerUp GPU-Z 2.2.0 program confirms this - the video card frequency reaches 1936 MHz at a voltage of 1.063 V.
When the temperature reaches 55°C, the video card fan starts rotating at 900 rpm. If the load is weak or short-term, the temperature begins to decrease, and the fan stops at 42°C.
Using MSI Afterburner 4.4.0 Beta 16, we set the fan rotation to the maximum value. At the same time, it spun up to 2300 rpm, and the noise emanating from the system unit was moderate.
FPS in games
Assassin's Creed Valhalla
(2020) Better than NVIDIA GeForce GTX 1660 Ti Mobile, but worse than NVIDIA Quadro RTX 3000 Max-Q.
| 1920×1080 / Ultra / 43.0 | 2560×1440 / Ultra / 37.3 | 3840×2160 / Ultra / 25.2 |
Valorant
(2020) Better than NVIDIA GeForce GTX 1660 SUPER, but worse than AMD Radeon R9 295X2.
| 1920×1080 / Ultra / 188.7 | 2560×1440 / Ultra / 154.3 | 3840×2160 / Ultra / 134.2 |
Death Stranding
(2020) Better than NVIDIA GeForce GTX 1660 SUPER, but worse than AMD Radeon R9 295X2.
| 1920×1080 / Ultra / 85.5 | 2560×1440 / Ultra / 66.3 | 3840×2160 / Ultra / 40.3 |
Cyberpunk 2077
(2020) Better than NVIDIA GeForce RTX 2060 Mobile, but worse than AMD Radeon R9 295X2.
| 1920×1080 / Ultra / 43.0 | 2560×1440 / Ultra / 40.1 | 3840×2160 / Ultra / 26.4 |
Apex Legends
(2019) Better than NVIDIA GeForce RTX 3050 Laptop GPU, but worse than NVIDIA GeForce GTX 1660.
| 1280×720 / Low / 144 | 1920×1080 / Medium / 127 | 1920×1080 / High / 113 | 1920×1080 / Ultra / 111 | 2560×1440 / Ultra / 73.7 | 2560×1440 / Ultra / 73.4 | 3840×2160 / Ultra / 44.0 | 3840×2160 / Ultra / 38.4 |
Metro Exodus
(2019) Better than NVIDIA GeForce GTX 1080 Max-Q, but worse than NVIDIA GeForce GTX 1070 Ti.
| 1280×720 / Low / 148 | 1920×1080 / Medium / 77.9 | 1920×1080 / High / 58.1 | 1920×1080 / Ultra / 48.5 | 2560×1440 / High / 38 | 2560×1440 / Ultra / 40.1 | 2560×1440 / Ultra / 37.6 | 3840×2160 / High / 23 | 3840×2160 / Ultra / 25.2 | 3840×2160 / Ultra / 23.4 |
Red Dead Redemption 2
(2019) Better than NVIDIA GeForce GTX 1660 SUPER, but worse than NVIDIA GeForce GTX 1660 Ti.
| 1280×720 / Low / 142 | 1920×1080 / Medium / 79.8 | 1920×1080 / High / 53 | 1920×1080 / Ultra / 33.8 | 2560×1440 / High / 27 | 2560×1440 / Ultra / 36.1 | 2560×1440 / Ultra / 27.3 | 3840×2160 / High / 18 | 3840×2160 / Ultra / 22.9 | 3840×2160 / Ultra / 17.5 |
PlayerUnknown's Battlegrounds
(2017) Better than AMD Radeon RX 570, but worse than AMD Radeon VII.
| 1280×720 / Low / 154.4 | 1920×1080 / Medium / 135.15 | 1920×1080 / High / 121.95 | 1920×1080 / Ultra / 80.5 | 2560×1440 / Ultra / 61.0 | 3840×2160 / Ultra / 35.0 | 3840×2160 / Ultra / 35 |
Overwatch
(2016) Better than NVIDIA GeForce GTX 1070 Mobile, but worse than NVIDIA GeForce RTX 2080 Mobile.
| 1280×720 / Low / 300 | 1366×768 / Medium / 297.2 | 1920×1080 / High / 272 | 1920×1080 / Ultra / 169 | 2560×1440 / Ultra / 103.6 | 3840×2160 / Ultra / 53.2 | 3840×2160 / Ultra / 86.75 |
Grand Theft Auto V
(2015) Better than AMD Radeon RX 480, but worse than NVIDIA GeForce RTX 2060.
| 1024×768 / Low / 174.1 | 1366×768 / Medium / 168.6 | 1920×1080 / High / 148 | 1920×1080 / Ultra / 74 | 2560×1440 / Ultra / 63.1 | 3840×2160 / Ultra / 29.7 | 3840×2160 / Ultra / 62 |
Counter-Strike: Global Offensive
(2012) Better than NVIDIA GeForce GTX 1080 Mobile, but worse than NVIDIA GeForce GTX 1660 Ti.
| 1920×1080 / Ultra / 275.3 | 2560×1440 / Ultra / 229.4 | 3840×2160 / Ultra / 206.5 |
League of Legends
(2019) Better than NVIDIA GeForce GTX 1080 Mobile, but worse than NVIDIA GeForce GTX 1660 Ti.
| 1920×1080 / Ultra / 516.1 | 2560×1440 / Ultra / 286.8 | 3840×2160 / Ultra / 114.7 |
The Witcher 3
(2015) Better than NVIDIA GeForce GTX 980 SLI, but worse than NVIDIA GeForce GTX 1080 Max-Q.
| 1024×768 / Low / 273.3 | 1366×768 / Medium / 194.4 | 1920×1080 / High / 119.5 | 1920×1080 / Ultra / 63.2 | 2560×1440 / Ultra / 62.0 | 3840×2160 / High / 43 | 3840×2160 / Ultra / 35.4 | 3840×2160 / Ultra / 43 |
Star Wars Jedi Fallen Order
(2019) Better than AMD Radeon RX 5700 XT, but worse than AMD Radeon RX 5700.
| 1920×1080 / Medium / 115 | 1920×1080 / High / 103 | 1920×1080 / Ultra / 93.4 | 2560×1440 / Ultra / 69 | 3840×2160 / Ultra / 34.1 |
Call of Duty: Modern Warfare
(2019) Better than NVIDIA GeForce GTX 1660 SUPER, but worse than NVIDIA Quadro RTX 5000 Max-Q.
| 1280×720 / Low / 177 | 1920×1080 / Medium / 113 | 1920×1080 / High / 103 | 1920×1080 / Ultra / 85.5 | 2560×1440 / High / 62 | 2560×1440 / Ultra / 61.5 | 3840×2160 / High / 34 | 3840×2160 / Ultra / 33.8 |
GRID 2019
(2019) Better than NVIDIA GeForce RTX 2070 Super Max-Q, but worse than NVIDIA GeForce RTX 2070.
| 1280×720 / Low / 218 | 1920×1080 / Medium / 134 | 1920×1080 / High / 105 | 1920×1080 / Ultra / 72.8 | 2560×1440 / Ultra / 59.9 | 3840×2160 / Ultra / 36.3 |
Borderlands 3
(2019) Better than NVIDIA GeForce GTX 1080 Max-Q, but worse than NVIDIA GeForce GTX 1080.
| 1280×720 / Low / 141 | 1920×1080 / Medium / 106 | 1920×1080 / High / 74.6 | 1920×1080 / Ultra / 57.9 | 2560×1440 / Ultra / 40 | 3840×2160 / Ultra / 21.4 |
Control
(2019) Better than NVIDIA GeForce GTX 1070 Mobile, but worse than NVIDIA GeForce GTX 1660 SUPER.
| 1280×720 / Low / 207 | 1920×1080 / Medium / 74.8 | 1920×1080 / High / 55.6 | 2560×1440 / Ultra / 35.2 | 3840×2160 / Ultra / 17.2 |
Rage 2
(2019) Better than NVIDIA GeForce GTX 1070 Mobile, but worse than NVIDIA GeForce GTX 1080 Max-Q.
| 1280×720 / Low / 188 | 1920×1080 / Medium / 93 | 1920×1080 / High / 81.1 | 1920×1080 / Ultra / 80 | 2560×1440 / Ultra / 50.3 | 3840×2160 / Ultra / 24.5 |
Anno 1800
(2019) Better than AMD Radeon RX 6600, but worse than NVIDIA GeForce RTX 2060 SUPER.
| 1280×720 / Low / 111 | 1920×1080 / Medium / 109 | 1920×1080 / High / 90 | 1920×1080 / Ultra / 43.3 | 2560×1440 / Ultra / 32.1 | 3840×2160 / Ultra / 18.8 |
The Division 2
(2019) Better than NVIDIA GeForce GTX 1080 Ti, but worse than NVIDIA GeForce GTX 1080.
| 1280×720 / Low / 200 | 1920×1080 / Medium / 122 | 1920×1080 / High / 97 | 1920×1080 / Ultra / 77 | 2560×1440 / Ultra / 53 | 3840×2160 / Ultra / 28 |
Dirt Rally 2.0
(2019) Better than NVIDIA GeForce GTX 1080, but worse than NVIDIA Quadro RTX 5000.
| 1280×720 / Low / 287 | 1920×1080 / Medium / 139 | 1920×1080 / High / 113 | 1920×1080 / Ultra / 72.6 | 2560×1440 / Ultra / 54.3 | 3840×2160 / Ultra / 33.1 |
Far Cry New Dawn
(2019) Better than NVIDIA GeForce GTX 1080 Max-Q, but worse than NVIDIA GeForce RTX 2070 Max-Q.
| 1280×720 / Low / 130 | 1920×1080 / Medium / 107 | 1920×1080 / High / 101 | 1920×1080 / Ultra / 91 | 2560×1440 / Ultra / 71 | 2560×1440 / Ultra / 71 | 3840×2160 / Ultra / 38 | 3840×2160 / Ultra / 38 |
Battlefield V
(2018) Better than NVIDIA GeForce RTX 2070 SUPER, but worse than NVIDIA GeForce GTX 1080 Mobile.
| 1280×720 / Low / 183.65 | 1920×1080 / Medium / 141.3 | 1920×1080 / High / 119.25 | 1920×1080 / Ultra / 106.7 | 2560×1440 / Ultra / 84 | 2560×1440 / Ultra / 83.6 | 3840×2160 / Ultra / 45 | 3840×2160 / Ultra / 44.9 |
Hitman 2
(2018) Better than NVIDIA GeForce RTX 2080 Ti, but worse than NVIDIA GeForce GTX 1080 Ti.
| 1280×720 / Low / 89.3 | 1920×1080 / Medium / 87.2 | 1920×1080 / High / 79.8 | 1920×1080 / Ultra / 74 | 2560×1440 / Ultra / 67.4 | 3840×2160 / Ultra / 37 |
Assassin's Creed Odyssey
(2018) Better than NVIDIA Quadro RTX 4000, but worse than NVIDIA GeForce RTX 2080 Super Max-Q.
| 1280×720 / Low / 107 | 1920×1080 / Medium / 88.5 | 1920×1080 / High / 76 | 1920×1080 / Ultra / 55 | 2560×1440 / Ultra / 45 | 2560×1440 / Ultra / 45 | 3840×2160 / Ultra / 26 | 3840×2160 / Ultra / 26 |
Forza Horizon 4
(2018) Better than NVIDIA GeForce GTX 1660 Ti, but worse than NVIDIA GeForce GTX 1070 Ti.
| 1280×720 / Low / 175 | 1920×1080 / Medium / 129 | 1920×1080 / High / 120.5 | 1920×1080 / Ultra / 94 | 2560×1440 / Ultra / 79 | 2560×1440 / Ultra / 79 | 3840×2160 / Ultra / 52 | 3840×2160 / Ultra / 52 |
Shadow of the Tomb Raider
(2018) Better than NVIDIA GeForce GTX 1660 Ti, but worse than NVIDIA GeForce GTX 1660 SUPER.
| 1280×720 / Low / 146 | 1920×1080 / Medium / 96 | 1920×1080 / High / 88 | 1920×1080 / Ultra / 77 | 2560×1440 / High / 52 | 2560×1440 / Ultra / 52 | 3840×2160 / High / 26 | 3840×2160 / Ultra / 26 |
Far Cry 5
(2018) Better than NVIDIA GeForce GTX 1080 Max-Q, but worse than NVIDIA Quadro RTX 4000.
| 1280×720 / Low / 137.5 | 1920×1080 / Medium / 105.5 | 1920×1080 / High / 99.5 | 1920×1080 / Ultra / 90 | 2560×1440 / Ultra / 68 | 2560×1440 / Ultra / 68 | 3840×2160 / Ultra / 35 | 3840×2160 / Ultra / 35 |
X-Plane 11.11
(2018) Better than NVIDIA GeForce GTX 1650 Ti Mobile, but worse than NVIDIA GeForce GTX 1050 Ti.
| 1280×720 / Low / 98 | 1920×1080 / Medium / 90 | 1920×1080 / High / 74.6 | 3840×2160 / Ultra / 66.4 |
Final Fantasy XV Benchmark
(2018) Better than NVIDIA GeForce RTX 2070 SUPER, but worse than NVIDIA GeForce GTX 1070 Ti.
| 1280×720 / Low / 147.2 | 1920×1080 / Medium / 87.45 | 1920×1080 / High / 61.3 | 3840×2160 / Ultra / 27.55 |
Rise of the Tomb Raider
(2016) Better than NVIDIA GeForce RTX 2060, but worse than NVIDIA TITAN RTX.
| 1024×768 / Low / 271.4 | 1366×768 / Medium / 195.4 | 1920×1080 / High / 119 | 1920×1080 / Ultra / 99.7 | 3840×2160 / Ultra / 42 |
Need for Speed Heat
(2019) Better than NVIDIA GeForce RTX 2070 Max-Q, but worse than NVIDIA TITAN RTX.
| 1280×720 / Low / 123 | 1920×1080 / Medium / 104 | 1920×1080 / High / 93.9 | 1920×1080 / Ultra / 76.4 | 2560×1440 / Ultra / 55.4 | 3840×2160 / Ultra / 30.8 |
Ghost Recon Breakpoint
(2019) Better than NVIDIA GeForce RTX 2060 Mobile, but worse than AMD Radeon RX Vega 64.
| 1280×720 / Low / 140 | 1920×1080 / Medium / 91 | 1920×1080 / High / 82 | 1920×1080 / Ultra / 61 | 2560×1440 / Ultra / 43 | 3840×2160 / Ultra / 24 |
FIFA 20
(2019) Better than NVIDIA GeForce GTX 1060 6GB, but worse than NVIDIA GeForce GTX 1080.
| 1280×720 / Low / 286 | 1920×1080 / Medium / 285 | 1920×1080 / High / 267 | 1920×1080 / Ultra / 257 | 2560×1440 / Ultra / 216 | 3840×2160 / Ultra / 146 |
F1 2019
(2019) Better than NVIDIA GeForce GTX 1080, but worse than NVIDIA GeForce RTX 2070.
| 1280×720 / Low / 248 | 1920×1080 / Medium / 185 | 1920×1080 / High / 152 | 1920×1080 / Ultra / 106 | 2560×1440 / Ultra / 82 | 3840×2160 / Ultra / 48 |
Anthem
(2019) Better than NVIDIA GeForce GTX 1080, but worse than NVIDIA GeForce GTX 1660 Ti.
| 1280×720 / Low / 139 | 1920×1080 / Medium / 99.2 | 1920×1080 / High / 85.2 | 1920×1080 / Ultra / 78.4 | 2560×1440 / Ultra / 54.4 | 3840×2160 / Ultra / 29.4 |
Just Cause 4
(2018) Better than NVIDIA GeForce GTX 1660 SUPER, but worse than NVIDIA GeForce GTX 1080 Max-Q.
| 1280×720 / Low / 152 | 1920×1080 / Medium / 110 | 1920×1080 / High / 89.2 | 1920×1080 / Ultra / 81.8 | 2560×1440 / Ultra / 58.1 | 3840×2160 / Ultra / 30.2 |
Darksiders III
(2018) Better than NVIDIA GeForce GTX 980, but worse than NVIDIA GeForce GTX 1080 Max-Q.
| 1280×720 / Low / 240 | 1920×1080 / Medium / 149 | 1920×1080 / High / 126 | 1920×1080 / Ultra / 103 | 2560×1440 / Ultra / 67.6 | 3840×2160 / Ultra / 33.5 |
Farming Simulator 19
(2018) Better than NVIDIA GeForce GTX 980, but worse than NVIDIA GeForce GTX 1080.
| 1280×720 / Low / 313 | 1920×1080 / Medium / 231 | 1920×1080 / High / 185 | 1920×1080 / Ultra / 144 | 2560×1440 / Ultra / 102 | 3840×2160 / Ultra / 54 |
Fallout 76
(2018) Better than NVIDIA GeForce GTX 980, but worse than AMD Radeon RX 580.
| 1280×720 / Low / 60 | 1920×1080 / Medium / 60 | 1920×1080 / High / 59.9 | 1920×1080 / Ultra / 59.9 | 2560×1440 / Ultra / 59.8 | 3840×2160 / Ultra / 44.45 |
Call of Duty Black Ops 4
(2018) Better than NVIDIA GeForce RTX 2060 SUPER, but worse than NVIDIA GeForce RTX 2070.
| 1280×720 / Low / 194.35 | 1920×1080 / Medium / 163.75 | 1920×1080 / High / 156.35 | 1920×1080 / Ultra / 146.75 | 2560×1440 / Ultra / 71.3 | 3840×2160 / Ultra / 49.5 |
FIFA 19
(2018) Better than AMD Radeon RX 580, but worse than AMD Radeon RX 580.
| 1280×720 / Low / 299.65 | 1920×1080 / Medium / 284.35 | 1920×1080 / High / 261.05 | 1920×1080 / Ultra / 258.65 | 2560×1440 / Ultra / 248 | 3840×2160 / Ultra / 117.4 |
F1 2018
(2018) Better than NVIDIA GeForce GTX 1660 Ti, but worse than NVIDIA Quadro RTX 4000.
| 1280×720 / Low / 230.5 | 1920×1080 / Medium / 176 | 1920×1080 / High / 140.5 | 1920×1080 / Ultra / 95 | 2560×1440 / Ultra / 75 | 3840×2160 / Ultra / 47 |
Monster Hunter World
(2018) Better than AMD Radeon RX Vega 56, but worse than NVIDIA GeForce GTX 1070 Ti.
| 1280×720 / Low / 137.4 | 1920×1080 / Medium / 100.45 | 1920×1080 / High / 93.2 | 1920×1080 / Ultra / 74.05 | 2560×1440 / Ultra / 47.8 | 3840×2160 / Ultra / 22.85 |
The Crew 2
(2018) Better than NVIDIA GeForce RTX 2080 Mobile, but worse than AMD Radeon RX 5700 XT.
| 1280×720 / Low / 60 | 1920×1080 / Medium / 60 | 1920×1080 / High / 60 | 1920×1080 / Ultra / 60 | 2560×1440 / Ultra / 60 | 3840×2160 / Ultra / 40.25 |
Kingdom Come: Deliverance
(2018) Better than NVIDIA GeForce GTX 1070 Mobile, but worse than NVIDIA GeForce RTX 2080 Max-Q.
| 1280×720 / Low / 141.9 | 1920×1080 / Medium / 108.6 | 1920×1080 / High / 87.75 | 1920×1080 / Ultra / 66.05 | 2560×1440 / Ultra / 47.1 | 3840×2160 / Ultra / 22.55 |
Fortnite
(2018) Better than NVIDIA TITAN RTX, but worse than NVIDIA GeForce GTX 1070 Mobile.
| 1280×720 / Low / 282 | 1920×1080 / Medium / 256.25 | 1920×1080 / High / 175.1 | 1920×1080 / Ultra / 126.95 | 2560×1440 / Ultra / 78.8 | 3840×2160 / Ultra / 38.85 |
Star Wars Battlefront 2
(2017) Better than AMD Radeon RX Vega 64, but worse than NVIDIA GeForce GTX 1070 Ti.
| 1280×720 / Low / 200 | 1920×1080 / Medium / 146 | 1920×1080 / High / 130 | 1920×1080 / Ultra / 114 | 2560×1440 / Ultra / 76.2 | 3840×2160 / Ultra / 38.1 |
Need for Speed Payback
(2017) Better than NVIDIA GeForce GTX 980, but worse than NVIDIA GeForce GTX 1080.
| 1280×720 / Low / 161 | 1920×1080 / Medium / 141 | 1920×1080 / High / 129 | 1920×1080 / Ultra / 120 | 2560×1440 / Ultra / 85.1 | 3840×2160 / Ultra / 44.3 |
Call of Duty WWII
(2017) Better than NVIDIA TITAN RTX, but worse than AMD Radeon RX Vega 56.
| 1280×720 / Low / 257.9 | 1920×1080 / Medium / 245.5 | 1920×1080 / High / 150 | 1920×1080 / Ultra / 117.6 | 2560×1440 / Ultra / 89 | 3840×2160 / Ultra / 58.1 |
Wolfenstein II: The New Colossus
(2017) Better than AMD Radeon RX 580, but worse than NVIDIA GeForce GTX 1070 Mobile.
| 1280×720 / Low / 238 | 1920×1080 / Medium / 152 | 1920×1080 / High / 119 | 1920×1080 / Ultra / 107 | 2560×1440 / Ultra / 73.7 | 3840×2160 / Ultra / 43 |
Destiny 2
(2017) Better than NVIDIA GeForce GTX 1080, but worse than NVIDIA GeForce RTX 2080 Ti.
| 1280×720 / Low / 174.75 | 1920×1080 / Medium / 159.4 | 1920×1080 / High / 147.85 | 1920×1080 / Ultra / 126.1 | 2560×1440 / Ultra / 65.3 | 3840×2160 / Ultra / 39.35 |
ELEX
(2017) Better than NVIDIA GeForce GTX 1070 Mobile, but worse than NVIDIA GeForce GTX 1080 Max-Q.
| 1280×720 / Low / 122 | 1920×1080 / Medium / 122 | 1920×1080 / High / 106 | 1920×1080 / Ultra / 82.6 | 2560×1440 / Ultra / 54.1 | 3840×2160 / Ultra / 28 |
The Evil Within 2
(2017) Better than NVIDIA GeForce RTX 2070 Max-Q, but worse than NVIDIA Titan X Pascal.
| 1280×720 / Low / 103 | 1920×1080 / Medium / 59.3 | 1920×1080 / High / 59.1 | 1920×1080 / Ultra / 58.9 | 3840×2160 / Ultra / 27.1 |
Middle-earth: Shadow of War
(2017) Better than NVIDIA GeForce GTX 980, but worse than NVIDIA GeForce GTX 1080.
| 1280×720 / Low / 168 | 1920×1080 / Medium / 140 | 1920×1080 / High / 112 | 1920×1080 / Ultra / 81 | 3840×2160 / Ultra / 32 |
Ark Survival Evolved
(2017) Better than NVIDIA GeForce GTX 1080 Max-Q, but worse than NVIDIA GeForce GTX 1080 Mobile.
| 1280×720 / Low / 130 | 1920×1080 / Medium / 82.6 | 1920×1080 / High / 59.4 | 1920×1080 / Ultra / 40.4 | 3840×2160 / Ultra / 15.1 |
Team Fortress 2
(2017) Better than NVIDIA GeForce GTX 980 Ti, but worse than NVIDIA GeForce GTX 1070 Ti.
| 3820×2160 / Ultra / 152 | 7680×4320 / Ultra / 152 |
Dirt 4
(2017) Better than NVIDIA TITAN RTX, but worse than NVIDIA GeForce GTX 1660 Ti.
| 1280×720 / Low / 323.45 | 1920×1080 / Medium / 225.75 | 1920×1080 / High / 166.5 | 1920×1080 / Ultra / 94.4 | 3840×2160 / Ultra / 55.65 |
Rocket League
(2017) Better than NVIDIA GeForce RTX 2060, but worse than NVIDIA Quadro T1000.
| 1280×720 / Low / 246.25 | 1920×1080 / Medium / 248.5 | 1920×1080 / High / 200.95 | 3840×2160 / Ultra / 95.4 |
Prey
(2017) Better than NVIDIA GeForce GTX 1080 Ti, but worse than NVIDIA Titan X Pascal.
| 1280×720 / Low / 144 | 1920×1080 / Medium / 143 | 1920×1080 / High / 142 | 1920×1080 / Ultra / 141 | 3840×2160 / Ultra / 57 |
Mass Effect Andromeda
(2017) Better than NVIDIA GeForce GTX 1060 6GB, but worse than NVIDIA GeForce GTX 1080.
| 1280×720 / Low / 163 | 1920×1080 / Medium / 126 | 1920×1080 / High / 89 | 1920×1080 / Ultra / 72.9 | 3840×2160 / Ultra / 36.6 |
Ghost Recon Wildlands
(2017) Better than NVIDIA Titan X Pascal, but worse than NVIDIA GeForce RTX 2060.
| 1280×720 / Low / 182.05 | 1920×1080 / Medium / 101.9 | 1920×1080 / High / 93.7 | 1920×1080 / Ultra / 52.15 | 3840×2160 / Ultra / 33.3 |
For Honor
(2017) Better than AMD Radeon RX Vega 56, but worse than NVIDIA GeForce GTX 1080 Max-Q.
| 1280×720 / Low / 300.3 | 1920×1080 / Medium / 158.85 | 1920×1080 / High / 150.2 | 1920×1080 / Ultra / 115 | 3840×2160 / Ultra / 47 |
Resident Evil 7
(2017) Better than NVIDIA GeForce GTX 1080 Max-Q, but worse than NVIDIA GeForce GTX 1070 SLI.
| 1280×720 / Low / 517 | 1920×1080 / Medium / 281 | 1920×1080 / High / 171 | 1920×1080 / Ultra / 141 | 3840×2160 / Ultra / 48.7 |
Dishonored 2
(2016) Better than NVIDIA GeForce RTX 2070, but worse than NVIDIA GeForce RTX 2080 Max-Q.
| 1280×720 / Low / 118.8 | 1366×768 / Medium / 118.4 | 1920×1080 / High / 101.2 | 1920×1080 / Ultra / 91.55 | 3840×2160 / Ultra / 41.8 |
Call of Duty Infinite Warfare
(2016) Better than NVIDIA GeForce GTX 1080 Max-Q, but worse than NVIDIA GeForce GTX 1080 SLI.
| 1920×1080 / Ultra / 119 | 3840×2160 / Ultra / 65.4 |
Titanfall 2
(2016) Better than NVIDIA GeForce GTX 1070 Mobile, but worse than NVIDIA GeForce GTX 1080 Mobile.
| 1920×1080 / Ultra / 122 | 3840×2160 / Ultra / 45.8 |
Farming Simulator 17
(2016) Better than NVIDIA GeForce GTX 1070 Mobile, but worse than NVIDIA GeForce GTX 1080 Ti.
| 1920×1080 / Ultra / 233 | 3840×2160 / Ultra / 126 |
Civilization VI
(2016) Better than NVIDIA GeForce GTX 980, but worse than NVIDIA GeForce GTX 1080.
| 1024×768 / Low / 90.1 | 1366×768 / Medium / 73.7 | 1920×1080 / High / 66.2 | 1920×1080 / Ultra / 66.7 | 3840×2160 / Ultra / 65.1 |
Battlefield 1
(2016) Better than NVIDIA GeForce GTX 1660 Ti, but worse than NVIDIA Titan X Pascal.
| 1280×720 / Low / 192.1 | 1366×768 / Medium / 179.6 | 1920×1080 / High / 136.75 | 1920×1080 / Ultra / 122.05 | 3840×2160 / Ultra / 52.4 |
Mafia 3
(2016) Better than NVIDIA GeForce GTX 980 Ti, but worse than NVIDIA GeForce GTX 1070 Max-Q.
| 1920×1080 / High / 50.6 | 3840×2160 / Ultra / 22.2 |
Deus Ex Mankind Divided
(2016) Better than NVIDIA TITAN RTX, but worse than NVIDIA GeForce RTX 2070 SUPER.
| 1280×720 / Low / 157.85 | 1366×768 / Medium / 139 | 1920×1080 / High / 82.35 | 1920×1080 / Ultra / 53.15 | 3840×2160 / Ultra / 28.3 |
Doom
(2016) Better than NVIDIA GeForce RTX 2080 Max-Q, but worse than NVIDIA GeForce RTX 2080 SUPER.
| 1920×1080 / Ultra / 132 | 3840×2160 / Ultra / 50.6 |
Ashes of the Singularity
(2016) Better than NVIDIA Quadro RTX 5000 Max-Q, but worse than NVIDIA GeForce RTX 2080 Max-Q.
| 1920×1080 / High / 77.05 | 3840×2160 / Ultra / 34.75 |
Hitman 2016
(2016) Better than NVIDIA GeForce GTX 1080 Mobile, but worse than NVIDIA GeForce GTX 1080.
| 1920×1080 / Ultra / 75.35 | 3840×2160 / Ultra / 37.7 |
The Division
(2016) Better than NVIDIA GeForce GTX 1080 Max-Q, but worse than AMD Radeon VII.
| 1280×720 / Low / 245.9 | 1366×768 / Medium / 192.1 | 1920×1080 / High / 109.3 | 1920×1080 / Ultra / 86 | 3840×2160 / Ultra / 42.2 |
Far Cry Primal
(2016) Better than NVIDIA GeForce GTX 1080, but worse than NVIDIA GeForce GTX 1080 Ti.
| 1280×720 / Low / 156 | 1920×1080 / Medium / 131 | 1920×1080 / High / 116 | 1920×1080 / Ultra / 94 | 3840×2160 / Ultra / 41 |
Rainbow Six Siege
(2015) Better than AMD Radeon RX Vega 64, but worse than NVIDIA GeForce GTX 1080 Ti.
| 1024×768 / Low / 334 | 1366×768 / Medium / 279.7 | 1920×1080 / High / 207.2 | 1920×1080 / Ultra / 181.5 | 3840×2160 / Ultra / 70.7 |
Fallout 4
(2015) Better than NVIDIA GeForce GTX 980 Ti, but worse than NVIDIA Titan X Pascal.
| 1920×1080 / Ultra / 111 | 3840×2160 / Ultra / 46.15 |
World of Warships
(2015) Better than NVIDIA GeForce GTX 1080, but worse than NVIDIA Titan X Pascal.
| 1920×1080 / Ultra / 163 | 3840×2160 / Ultra / 100 |
Dirt Rally
(2015) Better than NVIDIA GeForce GTX 1080 Ti, but worse than NVIDIA GeForce GTX 1080.
| 1920×1080 / Ultra / 134 | 3840×2160 / Ultra / 146 |
Dragon Age: Inquisition
(2014) Better than NVIDIA GeForce GTX 980 Ti, but worse than NVIDIA GeForce GTX 1080 Mobile.
| 1920×1080 / Ultra / 104.5 |
Battlefield 4
(2013) Better than NVIDIA GeForce GTX 1080, but worse than NVIDIA GeForce RTX 2080.
| 1024×768 / Low / 200 | 1366×768 / Medium / 200 | 1366×768 / High / 200 | 1920×1080 / Ultra / 152 | 3840×2160 / Ultra / 75 |
Metro: Last Light
(2013) Better than NVIDIA Quadro P5200, but worse than NVIDIA GeForce GTX 1080 Mobile.
| 1920×1080 / Ultra / 123 |
BioShock Infinite
(2013) Better than NVIDIA GeForce GTX 1660 SUPER, but worse than NVIDIA GeForce GTX 980 Ti.
| 1920×1080 / Ultra / 154.5 |
Crysis 3
(2013) Better than NVIDIA GeForce GTX 980 Ti, but worse than NVIDIA GeForce GTX 980 SLI.
| 1920×1080 / Ultra / 81.5 |
Assassin's Creed Origins
(2017) Better than NVIDIA GeForce GTX 1660 Ti, but worse than NVIDIA GeForce GTX 1070 Ti.
| 1280×720 / Low / 107 | 1920×1080 / Medium / 92.5 | 1920×1080 / High / 86.5 | 1920×1080 / Ultra / 72 | 2560×1440 / Ultra / 57 | 3840×2160 / Ultra / 32 |
F1 2017
(2017) Better than NVIDIA GeForce GTX 1080 Max-Q, but worse than NVIDIA TITAN RTX.
| 1280×720 / Low / 231 | 1920×1080 / Medium / 173 | 1920×1080 / High / 146 | 1920×1080 / Ultra / 104 | 3840×2160 / Ultra / 50 |
FIFA 18
(2017) Better than NVIDIA GeForce GTX 1060 6GB, but worse than AMD Radeon RX 580.
| 1280×720 / Low / 356 | 1920×1080 / Medium / 344 | 1920×1080 / High / 312 | 1920×1080 / Ultra / 298 | 3840×2160 / Ultra / 171 |
Mirror's Edge Catalyst
(2016) Better than NVIDIA GeForce RTX 2060 Mobile, but worse than NVIDIA GeForce GTX 1080 SLI.
| 1920×1080 / High / 114 | 1920×1080 / Ultra / 102 | 3840×2160 / Ultra / 39 |
XCOM 2
(2016) Better than NVIDIA GeForce GTX 980 Ti, but worse than NVIDIA GeForce GTX 1080.
| 1920×1080 / Ultra / 44.2 | 3840×2160 / Ultra / 26.3 |
Assassin's Creed Syndicate
(2015) Better than NVIDIA GeForce GTX 980 Ti, but worse than NVIDIA GeForce GTX 1080 Max-Q.
| 1920×1080 / Ultra / 49.9 | 3840×2160 / Ultra / 39.5 |
Star Wars Battlefront
(2015) Better than NVIDIA GeForce GTX 980 Ti, but worse than NVIDIA GeForce GTX 1080 Max-Q.
| 1920×1080 / Ultra / 143 | 3840×2160 / Ultra / 54.85 |
Call of Duty: Black Ops 3
(2015) Better than NVIDIA GeForce GTX 1070 SLI, but worse than NVIDIA GeForce GTX 1080 SLI.
| 1920×1080 / Ultra / 124 | 3840×2160 / Ultra / 47.75 |
Anno 2205
(2015) Better than NVIDIA GeForce GTX 1080 Mobile, but worse than NVIDIA GeForce GTX 1080.
| 1920×1080 / High / 140 | 1920×1080 / Ultra / 47 | 3840×2160 / Ultra / 57.5 |
Alien: Isolation
(2014) Better than NVIDIA GeForce GTX 1070 SLI, but worse than NVIDIA GeForce GTX 1080.
| 1920×1080 / Ultra / 190.5 |
Middle-earth: Shadow of Mordor
(2014) Better than NVIDIA GeForce GTX 1070 Mobile, but worse than NVIDIA GeForce GTX 1080 Mobile.
| 1920×1080 / Ultra / 129 |
Tomb Raider
(2013) Better than NVIDIA GeForce GTX 1070 Mobile, but worse than NVIDIA GeForce GTX 980 Ti.
| 1920×1080 / Ultra / 213 |
Test bench
- Motherboard: ASUS ROG CROSSHAIR VI HERO (BIOS 9920);
- Processor: AMD Ryzen 7 1800X overclocked to 3900 MHz at 1.285 V;
- Cooling system: EK-XLC Predator 240 Ryzen Edition;
- Thermal interface: Arctic Cooling MX-4;
- RAM: 2 x 8 GB KFA2 HOF Hall Of Fame (HOF4CXLBS4000M19SF162K,3466 MHz 14-14-14-14-28 CR1, singlerank Samsung B-Die);
- Video card: MSI GeForce GTX 1070 AERO ITX 8G OC / Nvidia GeForce GTX 10708 GB GDDR5;
- Power supply: Aerocool HIGGS-750W with a power of 750 Watts;
- System storage: SSD Plextor m7v128 GB;
- Case: Thermaltake View 31 TG.
What coins can you mine?
For mining cryptocurrencies on the MSI 1070 TI video card, coins of such algorithms as Equihash, 192.7 and 144.5 are best suited. Algorithms TimeTravel10, NeoScrypt, Lyra2z and the like bring no less profit.
Below is a list of coins that can be mined.
The profitability of a particular coin changes every day due to difficulty, as well as rate fluctuations. Mined coins
| Algorithms | Coins |
| NeoScrypt | Crowdcoin, Dinero, Feathercoin, GoByte, Halcyon, Innova, Vivo, Trezarcoin, Orbitcoin, Phoenixcoin |
| CryptoNightV7 | Monero, Electroneum |
| Ethash | Ethereum, Ethereum Classic, Ellaism, Metaverse, Expanse, Krypton, Ubiq, Soilcoin, Shift, Pirl, Musicoin |
| Equihash | Zclassic, Hush, Zcash, Zencash, BitcoinGold, Komodo, BitcoinZ, Bitcoin Interest, Bitcoin Private |
| TimeTravel10 | Bitcore |
| Lyra2REv2 | Monacoin, Galactrum, Rupee, Straks, Vertcoin, Verge |
| X16R | Ravencoin, Motion |
| Xevan | BitSend, Solaris |
| Equihash 192.7 | Zero |
| Equihash 144.5 | BitcoinZ |
| Lyra2z | Zcoin, GINcoin, Alpenshilling, Infinex, Taler, MCT, Stim, Criptoreal |
Cooling system testing and overclocking
The cooling system was tested using the Fire Strike stability test from the Futuremark 3DMark package. The room temperature was in the range of 24-26 ° C, the side cover of the case was closed, there was no additional cooling.
And in this case, we are faced with what we wrote about above - a lack of consumption limits, as a result - the voltage did not exceed 1.031 V, the peak frequency reached only 1898 MHz and dropped with increasing temperature and to maintain within the Power Limit. The temperature of the graphics processor in these conditions did not rise above 70°C, the fan at its peak spun up to 1600 rpm. For such a small video card, the result is excellent, but you should understand that in a cramped case the temperatures will be slightly higher.
Testing was carried out using these installations in popular synthetic tests.
Futuremark 3DMark
3DMark is the most popular benchmark suite used by both overclockers around the world and users looking to determine the graphics and processor performance of their computer.
The test consists of four scenes, two of which reveal the power of the video card (overall Graphics score), one - processor performance (Physics score), the last scene determines the overall performance of the system (Combined Score). It is the Graphics score that you need to focus on when testing a video card.
The test simulates the gaming load in FHD (Firestrike), QHD (Firestrike Extreme) and 4K (Firestrike Ultra) resolution. The Time Spy test application allows you to determine the performance of the video card and processor in the DirectX 12 API.
Unigine Superposition Benchmark
Another “young” test application that replaced Unigine Heaven and Unigine Valley (which, by the way, have not yet lost their popularity). As you can see, even in FHD resolution and Extreme settings, a colossal load is created on the video card.
Overclocking
Even for such a small video card, overclocking is not excluded. Considering that the graphics processor here is no different from those installed on the most sophisticated video cards, compensation for low factory overclocking (we would even say almost its complete absence) is quite possible using manual overclocking. The limiters in this case will be low power limits in the BIOS, the cooling system and Micron memory chips.
Using MSI Afterburner 4.4.0 Beta 16, we increased the consumption limits to the maximum possible, but the voltage, taking into account the limited Power Limit, did not increase.
In this case, it was possible to achieve 2062 MHz at peak, ultimately the frequency dropped to 1999 MHz. The memory frequency was increased to 2250 MHz (9000 MHz effective). Voltage was kept to 1.025 V to keep the card within power limits. Under these conditions, the temperature of the video card increased to 73°C, and the fan rotation increased to 1700 rpm.
However, as you know, Pascal generation video cards often show the ability to operate at high frequencies at low voltage. Using this knowledge, we reduced the operating voltage to 0.993 V. Under these conditions, the graphics processor frequency was raised to 2038 MHz, while the video memory frequency remained unchanged.
The temperature and fan speed did not change, but moments of exceeding the power limit, as well as reducing the frequency, began to appear less frequently. As a result, we got an increase in the average operating frequency and an improvement in its stability.
With the fan set to maximum, we also ran a stability test on the Firestrike.
The GPU frequency rose to 2050 MHz, the GPU temperature did not exceed 64°C, and the frequency graph became even straighter.
Under these conditions, we received an 11% increase in performance in Firestrike and Time Spy, and a 12% increase in Firestrike Extreme and Firestrike Ultra.
The increase in performance is pleasant, especially considering the low heat and lack of noise. But we have not gotten rid of the main problem - consumption limits. To do this, let's do some research.
Installing a third-party BIOS version
When searching for a third-party BIOS, our choice fell on the MSI GeForce GTX 1070 GAMING Z 8G. This video card has high factory overclocking and high consumption limits compared to the heroine of our review. There is also a BIOS version online with fixes for Micron memory.
As a result, BIOS version 86.04.50.00.29 was installed on the video card
The base frequency in it is increased to 1633 MHz, the acceleration frequency is up to 1835 MHz. The frequency of memory chips was also not ignored and was increased to 2025 MHz (8100 MHz effective). And most importantly, the consumption limits are 230 W, expandable to 291 W!
That's what we need. There is no need to even move the Power Limit slider upward.
Without overclocking, the core frequency reached 2025 MHz even at 46°C! That is, we have almost reached the maximum frequencies for the native BIOS version without any overclocking. However, the difference in cooling systems made it possible to push back the fan start bar on the MSI GeForce GTX 1070 GAMING Z 8G to ~62°C. This is unacceptable for our video card, so using MSI Afterburner we changed the fan speed curve as follows.
Without overclocking, we obtained the following results in the Firestrike stability test:
The maximum frequency of the video card reached 2012 MHz, the voltage was 1.062 V, and the consumption limits did not exceed 45.5% according to monitoring. As a result, there was no frequency reset, nor was there a stop in the Power Limit. What we've been waiting for.
Some change in the fan rotation led to a decrease in the maximum temperature to 69 ° C, but the fan rotated at its peak already at 1900 rpm. It must be admitted that the noise from the single fan was acceptable.
But let's return to the goal of our experiment - finding the maximum overclocking for our video card instance. And he did not disappoint us.
Without increasing the voltage (which did little except heat up), the GPU frequency was increased to 2152 MHz, and the memory chip frequency was increased to 2275 MHz (9100 MHz effective).
At 1800 rpm, the GPU warmed up to 72°C, which is a good result for full-fledged cards, not to mention the ITX format.
The increase in performance, even relative to the results obtained when overclocking on the native version of the BIOS, cannot be called invisible.
We saw a 3% performance increase in Firestrike, and a 4% performance increase in Firestrike Extreme, Firestrike Ultra and Time Spy.
If the graphics memory had greater overclocking potential (Samsung chips would be enough), then the results would be even better. However, in relation to the factory settings, the increase looks much more impressive:
Benchmark tests
3DMark Cloud Gate GPU: 106934
Better than NVIDIA GeForce GTX 1070 Max-Q, but worse than NVIDIA GeForce RTX 2060.
3DMark Cloud Gate Standard Score: 30229.5
Better than NVIDIA GeForce GTX 1060 6GB, but worse than NVIDIA GeForce RTX 2060 Max-Q.
3DMark Fire Strike Graphics: 18255
Better than NVIDIA GeForce GTX 1080 Max-Q, but worse than NVIDIA RTX A3000 Mobile.
3DMark Fire Strike Score: 14984
Better than NVIDIA GeForce GTX 1660 SUPER, but worse than NVIDIA Quadro RTX 4000 Max-Q.
3DMark Ice Storm GPU: 463865
Better than NVIDIA GeForce RTX 2070 Super Max-Q, but worse than AMD Radeon RX 6800M.
3DMark Time Spy Graphics: 5896
Better than NVIDIA GeForce GTX 1080 Max-Q, but worse than AMD Radeon RX 5600M.
3DMark Time Spy Score: 5679
Better than NVIDIA GeForce GTX 1080 Max-Q, but worse than NVIDIA GeForce GTX 1660 Ti Mobile.
3DMark Vantage P: 50995
Better than NVIDIA GeForce RTX 2060 Max-Q, but worse than NVIDIA GeForce RTX 2080 Max-Q.
3DMark06: 37799.5
Better than NVIDIA GeForce RTX 2080 Max-Q, but worse than NVIDIA GeForce RTX 2080 SUPER.
3DMark11P: 19449
Better than NVIDIA GeForce RTX 2070 Max-Q, but worse than NVIDIA GeForce GTX 1660 Ti.
3DMark11P GPU: 24652
Better than NVIDIA Quadro RTX 5000, but worse than NVIDIA Quadro RTX 4000.
Cinebench R10 32Bit OpenGL: 6835
Better than NVIDIA GeForce RTX 2070 Super Max-Q, but worse than NVIDIA Quadro P3000.
Cinebench R15 OpenGL 64Bit: 136.03
Better than AMD Radeon RX Vega 64, but worse than NVIDIA Quadro P1000.
ComputeMark v2.1 Normal, Score: 13488.5
Better than NVIDIA GeForce GTX 1070 SLI, but worse than NVIDIA Quadro RTX 4000.
LuxMark v2.0 64Bit Sala GPUs-only: 4444.5
Better than NVIDIA GeForce GTX 1660 Ti, but worse than NVIDIA GeForce GTX 1660 SUPER.
Passmark: 13352
Better than NVIDIA Quadro RTX 4000, but worse than AMD Radeon RX Vega 56.
SPECviewperf 12 - 3ds Max: 169
Better than AMD Radeon VII, but worse than AMD Radeon RX 5700 XT.
SPECviewperf 12 - Maya: 132
Better than NVIDIA GeForce GTX 1660 SUPER, but worse than NVIDIA GeForce RTX 2080 SUPER.
SPECviewperf 12 - Showcase: 82
Better than NVIDIA GeForce GTX 1070 Mobile, but worse than NVIDIA Quadro RTX 3000.
Unigine Heaven 4.0: 2815
Better than NVIDIA GeForce GTX TITAN X, but worse than NVIDIA Quadro P4000.
Unigine Valley 1.0 Extreme HD DirectX: 92.6
Better than NVIDIA GeForce RTX 2060, but worse than AMD Radeon RX 6600.
Gaming Performance
Game tests were carried out in resolutions of 1920x1080 and 2560x1440 with maximum graphics settings, only the anti-aliasing settings were changed depending on the resolution. Only the DirectX 11 API was used, testing was carried out in built-in gaming applications. The video card settings were at factory settings.
As a result, the following results were obtained:
For such a miniature video card, these results are very impressive.
