Stock market indices are unique indicators that can show the state of the country's economy or individual sectors of the economy, helping investors assess the current state of the market economy. The collected data provides the most holistic picture, allowing you to make any investment decisions.
There are many different indices in the investing world that serve different purposes. Some indices focus on a smaller portion of the market, while other indices reflect the health of the technology sector.
Indexes can be large or small: one index may track 5-10 companies, while other indexes may cover thousands of companies. Such indices serve different purposes for different investors, some invest in technology, others investors bet on industry or finance.
Today we will make a brief overview of the main indices of the world's largest economy - the United States.
S&P 500
This stock index consists of 500 American companies that have the largest capitalization. The list has been compiled by Standard & Poor's since 1957.
Shares of companies included in the S&P 500 basket are traded on the largest US exchanges: NASDAQ and NYSE. The index is calculated by capitalization and, together with the Dow Jones, is a key benchmark for investors. Sometimes the phrase “barometer of the US economy” is even used for it.
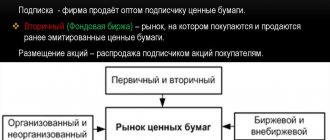
Stock market
Stock exchanges are an attractive financial market where several billion dollars of trading are carried out every day. Currently, the US stock exchanges are considered the largest financial centers in the world, and the main indicators of the situation on them are stock market indices.
Stock trading in the United States is carried out on 13 stock exchanges, but most often the attention of investors is attracted by three of them:
| Exchange name | A comment |
| NYSE Euronext | The New York Stock Exchange and the European Stock Exchange merged in 2007. Now it is the world's largest exchange by capitalization volume |
| NASDAQ | Is an over-the-counter market for shares of companies engaged in high-tech developments |
| AMEX | Cooperates with young promising enterprises with small capitalization |
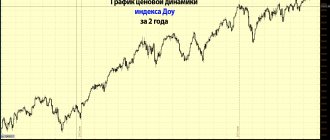
Dow Jones Industrial
It is the oldest market index in the world and was created by Charles Dow when he was editor of the Wall Street Journal. Using this indicator, it was proposed to monitor the development of the industrial sector of the American economy. The word industrial was retained in the name as a tribute to the times, although today not all companies in the Dow basket belong to the industrial sector.
These days, the Dow Jones is calculated using a scaled average—the total value of 30 stocks divided by an ever-changing metric, the calculation of which depends on the number of stocks in the index.
Many investors do not consider the Dow Jones to be a reputable index that reflects an accurate economic picture and stock market behavior. As an alternative, many people choose the S&P 500, which consists of 500 rather than 30 player companies.
Another disadvantage of the Dow Jones is that it is calculated by adding up the stock prices of individual companies and then dividing them by an overall ratio. Because of this, companies with expensive shares often set the overall mood for the entire basket.
This can be illustrated like this: Let's say the index takes into account the shares of 3 companies, the prices of which are equal to $1, $5 and $10, and the divisor is 0.5. Accordingly, the index is equal to 8. If the shares with the highest price fall by 30%, the index will fall to 6.5, that is, a loss of 19%. If the cheapest share doubles in price, the index will only rise to 8.5, that is, by 6.2%.
The Dow Jones includes shares of companies such as:
— American Express Co. [NYSE:AXP] - Boeing Co. [NYSE:BA] - Coca-Cola Co. [NYSE:KO] - Intel Corp. [NASDAQ: INTC] - Johnson & Johnson Inc. [NYSE: JNJ] - WalMart Inc. [NYSE: WMT] - Visa Inc. [NYSE: V] and others.
NASDAQ 100
This index has been calculated since 1985 and includes the hundred largest US companies with the largest capitalization (excluding the financial sector). Since 1998, the index has taken into account not only American companies. Most of the businesses that make up the NASDAQ 100 index are in the technology, communications, internet marketing and related industries.
The index includes the same companies that are present in the other mentioned indices, the same Facebook Inc. [NASDAQ: FB] or Apple Inc. [NASDAQ: AAPL], as well as other major projects in this sector.
The NASDAQ 100 currently includes stocks from the US, Canada, Singapore, India, Israel, China, Ireland, Switzerland and Sweden.
For investors, the NASDAQ 100 is an authoritative indicator due to the fact that:
— Places very strict demands on its participants; — Significantly depends on global market sentiment; — Approximately 10% consists of companies not from the United States of America.
Russell 2000
This stock index is fundamentally different from those presented above because it reflects the behavior of shares of projects with small capitalization (on average, about $255 million).
The index began publishing in 1987 by Russell Investments and was offered as an objective measure of the small-cap market. The significant rise in value and popularity of the Russell 2000 in the 1990s was driven by strong moves from companies in its basket.
The securities in the index are divided into two pools: Value and Growth (with low and high growth rates). It is noteworthy that in its history, the Russell 2000 has reached a “death crossing” 19 times (a fall below the 200- and 50-day moving averages, after which a prolonged market decline could be observed), but has always emerged safely from the situation and showed good dynamics.
Peculiarities
With the help of some stock indices, it is possible to judge with a high degree of accuracy the state of the economic sphere related to them. In addition, they help track the dynamics of changes in any global economy. The largest stock market, the American stock market and its performance have a great influence on the US dollar, the world market and the economy in the world as a whole.
A stock market index is an indicator that displays the changes in the price of different assets. The number in the title indicates the number of companies whose shares were taken into account in the calculation.
To reflect real trends in a certain sector of the economy, the stock index must meet certain requirements:
- stability;
- easy calculation based on publicly available data;
- coverage of a wide range of financial assets selected for analysis.
Since the US stock market is one of the largest in the world, there are a huge number of American stock indices (more than 1,000). Many of them formed families, which are conventionally divided into:
- Composite, the calculation base of which is based on companies in different industries.
- Sectoral ones, which show the dynamics of development of a specific sector of the economy.
We recommend that you familiarize yourself with the most popular and influential stock indices: S&P 500 and Dow Jones Industrial.
S&P 500
It is a composite index consisting of shares of five hundred US companies with the largest capitalization:
- twenty transport;
- forty communal;
- four hundred industrial;
- forty financial.
Shares of these companies are traded on major US exchanges. Many investors rely on this index and call it the “barometer of the US economy.” However, it should not be taken as a list of giants of the American economy, as it does not include projects with insufficient liquidity of shares and private firms. For the most complete coverage, the authors try to compile a basket of companies from various sectors of the economy.
The index is calculated using the weighted capitalization method, when the weight of a company in its basket is directly proportional to its capitalization: that is, a large company has more influence on the indicator. When selected, enterprises must meet certain requirements and have:
- legal registration in the USA;
- activities in the field of production or services;
- capitalization more than 4 billion dollars;
- high liquidity of shares;
- more than 50% of shares in free float.
Traders admit that the S&P 500 index is convenient because:
- The change in value is expressed not in dollars, but as a percentage.
- It focuses not only on the largest companies, but also shares of small enterprises from different areas of the economy.
Dow Jones Industrial
The Dow Jones Industrial Average is the oldest index of 30 US industrial giants that are considered blue chips. This indicator was supposed to be used to monitor the development of American industry. The word Industrial is retained in the name, although today not all of the companies that make up the Dow basket are related to the industrial sector of the economy.
Many investors do not consider this index to be authoritative, since it does not accurately reflect the situation in the economy and the stock market, and they prefer the S&P 500, which consists of five hundred rather than thirty player firms.
Another disadvantage of the Dow Jones Industrial is that its calculation is made up of the stock prices of different companies and divided by a common ratio. As a result, companies with high share prices impart an overall sentiment to the entire basket. The list of companies that make up the indicator is constantly revised and depends on the current state of the market. The list includes such giants as:
- Microsoft;
- Boeing;
- Coca Cola;
- Intel;
- General Electric;
- American Express;
- Walt Disney;
- Chevron;
- McDonald's;
- Pfizer and others.
The Dow Jones index represents approximately a 25% share of the value of the United States stock market. It can be used as an indicator not only for large companies, but also to determine the main direction of the entire market.
A few more stock indices:
| Index | Description |
| NASDAQ 100 | It is composed of hundreds of companies with the largest capitalization (except for the financial sector) and takes into account not only US companies. A significant part of them included in the basket are IT companies that are engaged in high technology, communications, Internet marketing and related areas. Currently, this index takes into account the stock prices of companies in many countries besides the United States: Canada, Israel, Singapore, India, China, Switzerland, Ireland and Sweden. The authority of this indicator for investors is that:
|
| Russell 2000 | It is fundamentally different from those described above, since it reflects the dynamics of the behavior of the assets of enterprises with small capitalization. The publication of the indicator was proposed for an objective assessment of the market for small companies. The value and popularity of this indicator increased significantly in the 1990s due to strong moves by the companies that make up its basket. Assets are divided into two pools:
It should be noted that in the history of this index there were 19 “deadly crossovers” (drops in the average that could cause a long-term market decline), but it always came out of this situation safely and was characterized by good dynamics |
| CBOE Volatility Index | This indicator is calculated by the Chicago Board Options Exchange. Denoted VIX, it shows the overall market expectation regarding options on the S&P 500. Please note that this index is a guess rather than a guaranteed forecast. The indicator is inversely proportional to stock indices. This means that it rises when the market falls and falls when the market rises. For example, when most investors are “running away” from risks, the VIX rises by 40-45 points. In the case when trading is calm and there is a low probability of risks, it is approximately 20 points. Investors perceive the fall in volatility with alarm, as growth was expected. Experienced financiers in this case recommend fixing income |
| NYSE Composite | The indicator is calculated by the New York Stock Exchange and is expressed not in points, like most indices, but in dollar terms. It reflects the stock market position according to a database of thousands of companies. The listing of this exchange is considered very prestigious, and getting on the list is a source of pride for any company |
| AMEX | This exchange publishes dozens of indices, the most famous of which is the Main Market Index. The calculation is based on data from the top twenty US corporations |
| Wilshire 5 000 | It has a high degree of diversification, as it includes shares of different sectors of the economy. Also called the “general stock market index.” It received this name for its coverage of the majority of American companies listed on stock exchanges. But in the debate over traders’ preferences, it still loses to the S&P 500 |
CBOE Volatility Index
This index has been calculated by the Chicago Board Options Exchange since 1993 and is designated VIX. In simple terms, this indicator demonstrates the overall market expectation regarding options on the S&P 500. However, it is important to understand that the VIX remains a guess and not a guaranteed forecast.
CVOE Volatility Index is inversely proportional to stock indexes, that is, it increases when the market falls and decreases when it rises. For example, when the bulk of investors run away from risks in fear, VIX rises to 40-45 points. During calm trading with a low overall risk expectation, it stays within 20 points. A strong drop in volatility is perceived as alarming, since all investors obviously expect it to rise. Experienced specialists recommend taking profits in this case.
The dependence of the volatility index on the market situation well reflects its growth during the crisis years of 1997, 1998 and 2001, as well as in October 2008, when it reached a record of 89.53 points.
How do investors use US and foreign stock indices?
The study of specific stock indices gives investors information about the general nature of changes in stock quotes of companies from a certain sector or group.
In general, index tracking has the following goals:
— Obtaining information about the general dynamics of quotes of companies included in a specific basket. — Obtaining information about how investors evaluate the market at the current moment. — Long-term study of the investment climate in a group of companies, industry or country. — Obtaining generalized data on the activity of players in the securities market.
In addition to the US stock indices presented in our article, there are hundreds of analogs in the world developed by agencies and exchanges to reflect the economic situation in countries and industries. The world's leading stock indices also include DAX (the 30 largest companies in Germany), Nikkei 225 (the Asian analogue of the S&P 500, consisting of 225 companies on the Tokyo exchange), FTSE 100 (describes the hundred largest players on the London Stock Exchange), CAC 40 (Paris Stock Exchange) , Russian MICEX and RTS (50 largest and most liquid companies in Russia).
How to make money on these indices
You cannot buy stock indices directly. However, there are instruments on the market that replicate their dynamics - mutual funds and ETFs.
ETFs are the most modern option and are also cheaper. In the West, the number of funds is so large that you can find ETFs for almost any index.
You can buy part of such a fund through domestic and foreign brokers, insurance companies and banks.
The cheapest option is to use a broker. Banks and insurance companies are more expensive.
Here is a list of ETFs with which you can buy the US indices described above:
- DJI - DIA, DDM;
- SP500 - SPY;
- Nasdaq Composite - ONEQ;
- Nyse composite - NYC;
- NYSE ARCA - FBT, XLK;
- Wilshire 5000 - WFIVX;
- Russel 2000 - IWM, VTWO, SPSM.
In Russia there is only 1 ETF for the American market - FXUS. And yes, you can buy it on IIS.
Caution about BO and Forex
Expert opinion
Anna Ovchinnikova
Private investor, entrepreneur and founder of the portal fonda.pro
Ask a Question
To make a profit, you should not consider options such as Forex and BO. Forex is intended for professional participants (qualified investors, banks, funds). Numerous offices are scammers and bookmakers who offer large profits (500, 1000%) in the shortest possible time.
If Forex in Russia is somehow trying to regulate, with BO the situation is completely different. Binary options for the masses are a casino in favor of the owners. Real BOs are traded only on foreign exchanges in a limited number. It is very difficult for a Russian trader to get there; he must have a large account in a foreign bank.
And most importantly, ETFs are not traded there. They can only be bought on the stock exchange.
Best brokers
Here is a list of verified brokers with a Central Bank license:
Keith Rick Opening Exante CapTrader
Small but reliable broker. It is great for beginners because it does not impose its services and the commissions are very low. I recommend.
One of the very first Russian brokers. The commissions are high, but there are interesting auto-following strategies.
One of the mastodons of the market. Excellent web portal, very low commissions and adequate support. I recommend!
Maltese broker. You have access to any exchange in the world and your own trading terminal. Commissions are average.
German reseller Interactive Brockers. The same as the American one, only there is no monthly mandatory commission. I recommend it.