Greetings! How do you find out about the current state of the Russian economy? Some people scroll through social networks all day, others listen to the news.
Or you can do it simpler: once a day, track the dynamics of one of the two most important indices in Russia. The RTS index has fallen – the economy continues to move downwards, the crisis is worsening. It has grown by a couple of points - domestic companies are becoming more expensive, and there is hope for the situation to improve.
And even if you do not plan to trade on the stock exchange, the main Russian indicator will help you soberly assess the current situation.
So, the RTS index: dynamics over the past ten years and the reasons for the fall.
What is the RTS index
The RTS Index is a weighted average composite index calculated based on the prices of the most liquid Russian shares of the largest companies and dynamically developing Russian issuers listed on the Moscow Exchange ( MICEX , MOEX), such as Gazprom, X5 Retail Group, MTS, Norilsk Nickel, Yandex and many others . The index was launched in 1995 and is calculated in real time. The Russian Trading System is one of the leading stock exchange indices in Russia and reflects the performance of its market economy.
The number of companies in the RTS may change depending on their dynamics, but the number of organizations should not exceed 50. Currently, as of April 2022, the Russian index includes 38 companies from different industries, covering the economies:
- Oil industry and gas (energy resources) - 45%;
- Financial sector - 19.4%;
- Metals and mining - 17.1%;
- Consumer sector of the economy - 10.1%;
- Telecommunications - 3.3%;
- Electric power industry - 2.8%;
- Others (transport companies, chemistry, petrochemicals, etc.) - 2.2%;
This list is reviewed by the RTS committee. Companies are approved regularly on a quarterly basis to ensure the index is current and accurate. The peculiarity of the RTS composite index is that it is one of the few Russian indices whose dynamics are calculated in US dollars. This allows you to monitor the dynamics of the Russian index and track the correlation with the performance of foreign stock markets.
RTS is a weighted average index and includes only free-float shares in its calculation. The index is freely floated, excluding all government stocks, which provides a realistic representation of market trends, giving us a better idea of where the economy is actually heading, or at least how markets perceive it to be doing. This, of course, means that Gazprom (OTCPK: OGZPY )(OTCQX: GZPFY), the natural gas giant, has less influence (weight) on the RTS index, although its market capitalization is huge (relative to other Russian companies). Therefore, it is very important to analyze the components of the index, but we will return to this later.
Note : free-float coefficient reflects the number of shares in free float. The liquidity of the stock market, share prices and risks associated with exchange on exchanges can directly depend on this coefficient. Free-float allows you to estimate how many securities are currently available for purchase or sale, and is expressed as a share of the total turnover of shares. For example, for Aeroflot PJSC this coefficient is 0.41. This means that 41% of the shares of this company are currently freely traded on the market, and investors can buy or sell them.
Index futures and options
Futures and options on futures on the RTS Index, Moscow Exchange Index, and Blue Chip Index provide a wide range of opportunities for hedging risks in stock portfolios and for playing on the rise or fall of the stock market. Index derivatives are equally accessible to both small investors and large market participants.
Index futures are standard contracts that are settled not by delivery of the underlying asset, but by cash settlement. By concluding transactions with index futures, trading participants undertake to pay or receive the difference (variation margin) between the transaction price and the execution price of the futures contract.
The main indices of the Moscow Exchange - the Moscow Exchange Index (formerly the MICEX Index) and the RTS Index - are price, market capitalization-weighted (free-float) composite indices of the Russian stock market, including the most liquid shares of the largest and dynamically developing Russian issuers, the types of economic activities of which belong to the main sectors of the economy represented in PJSC Moscow Exchange.
| Contract name | Futures contract for the Moscow Exchange Index | Futures contract for the Moscow Exchange Index (mini) | Futures contract on the RTS Index | Futures contract on the RTS Index (mini) | Blue Chip Index Futures Contract | Futures contract on the Russian Market Volatility Index |
| Code | MIX | MXI | RTS | RTSM | RTSS | RVI |
| Quotation | 100 x Moscow Exchange Index in points | Moscow Exchange index in points | 100 x RTS Index in points | RTS index in points | Blue chip index in points | Volatility |
| Price step | 25 points | 0.05 points | 10 points | 0.5 points | 1 point | 0.05 points |
| Price step cost | 25 RUB | 0.5 RUB | 0.2 USD | 0.1 USD | 10 rubles | 0.1 USD |
| Relation to standard contract | 1:1 | 1:10 | 1:1 | 1:10 | 1:1 | 1:1 |
| Contract type | Calculated | |||||
About contracts
Bidding information
|
Current prices of futures contractsBasic parameters of a futures contract - to view, click on the contract code in the first column | |||||||
| Indexes | |||||||
| -0,26% | 3 897,95 | 3 853,15 | 25 178 | 5 595 | 30 430 | ||
| MXI-6.22 | 3 889,15 | -0,58% | 3 917,85 | 3 884,25 | 21 | 15 | 676 |
| MXI-9.22 | — | — | — | — | — | — | 116 |
| MXI-12.22 | — | — | — | — | — | — | 8 |
| MXI-6.24 | — | — | — | — | — | — | 8 |
| MXI-9.24 | — | — | — | — | — | — | 4 |
| MXI-12.24 | 4 000 | +0,47% | 4 000 | 4 000 | 1 | 1 | 14 |
| MXI-3.25 | 3 645,35 | — | 3 650,25 | 3 645,35 | 3 | 3 | 6 |
| Futures contract for the Moscow Exchange Index | |||||||
| MIX-3.22 | 386 025 | -0,30% | 389 775 | 385 375 | 15 328 | 9 453 | 19 592 |
| MIX-6.22 | 388 700 | -0,37% | 388 700 | 388 550 | 5 | 5 | 6 322 |
| MIX-9.22 | — | — | — | — | — | — | 20 |
| MIX-12.22 | — | — | — | — | — | — | 18 |
| Futures contract on the RTS Index | |||||||
| RTS-3.22 | 160 590 | -0,04% | 162 040 | 160 180 | 345 925 | 182 004 | 522 700 |
| RTS-6.22 | 157 560 | -0,08% | 159 000 | 157 190 | 732 | 604 | 5 140 |
| RTS-9.22 | 154 750 | -0,42% | 154 950 | 154 500 | 8 | 8 | 14 354 |
| RTS-12.22 | 154 750 | +0,24% | 154 750 | 154 750 | 1 | 1 | 420 |
| RTS-3.23 | — | — | — | — | — | — | 66 |
| RTS-6.23 | — | — | — | — | — | — | 24 |
| RTS-9.23 | — | — | — | — | — | — | 16 |
| RTS-12.23 | — | — | — | — | — | — | 14 |
| Futures contract on the RTS Index (mini) | |||||||
| RTSM-3.22 | 1 606 | -0,03% | 1 620,5 | 1 602 | 13 666 | 4 645 | 23 422 |
| RTSM-6.22 | 1 580 | +0,22% | 1 590 | 1 571,5 | 229 | 120 | 544 |
| RTSM-9.22 | 1 567 | -0,29% | 1 592 | 1 562 | 5 | 5 | 88 |
| RTSM-12.22 | — | — | — | — | — | — | — |
| Blue Chip Index Futures Contract | |||||||
| RTSS-3.22 | — | — | — | — | — | — | — |
| RTSS-6.22 | — | — | — | — | — | — | — |
| Futures contract on Russian market volatility | |||||||
| RVI-1.22 | 33,45 | -0,30% | 33,45 | 32,15 | 9 | 9 | 64 |
| RVI-2.22 | — | — | — | — | — | — | — |
| RVI-3.22 | — | — | — | — | — | — | — |
| Quotes for futures contracts are given as of 01/13/2022 14:05 |
Composition of the RTS index
As we have already said, the RTS index includes 38 large Russian companies on the stock market. Previously, it included 50 companies, but the Moscow Exchange decided to exclude some companies in order to optimize the stability of the stock index. The table presents data for 38 companies included in the RTS index: name, price and capitalization in dollars, share in the index, etc.
Table
| # | Tool code | Company name | Price, USD | Total number of securities | Capitalization, USD | Free-float, (FFi) | Weight limiting factor (Wi) | Capitalization taken into account in the index, USD | Weight, % |
| 1 | AFKS | JSFC Sistema JSC | 0,194 | 9 650 000 000 | 1 872 129 891,37 | 0,33 | 1 | 617 802 864,15 | 0,42 |
| 2 | AFLT | PJSC Aeroflot, JSC | 1,06681 | 1 110 616 299 | 1 184 820 975,1 | 0,41 | 1 | 485 776 599,79 | 0,33 |
| 3 | ALRS | AK "ALROSA" (PJSC), JSC | 0,89826 | 7 364 965 630 | 6 615 674 442,37 | 0,34 | 1 | 2 249 329 310,4 | 1,53 |
| 4 | SVOM | PJSC "MCB", JSC | 0,07634 | 29 829 709 866 | 2 277 265 137,58 | 0,2 | 1 | 455 453 027,52 | 0,31 |
| 5 | CHMF | PJSC Severstal, JSC | 12,18442 | 837 718 660 | 10 207 118 871,2 | 0,2 | 1 | 2 041 423 774,25 | 1,39 |
| 6 | DSKY | PJSC Detsky Mir, JSC | 1,3587 | 739 000 000 | 1 004 078 261,91 | 0,55 | 1 | 552 243 044,05 | 0,38 |
| 7 | FEES | PJSC FGC UES, JSC | 0,00245 | 1 274 665 323 060 | 3 120 017 794,81 | 0,18 | 1 | 561 603 203,07 | 0,38 |
| 8 | FIVE | X5 RETAILGROUP NVORD SHS | 30,10906 | 271 572 872 | 8 176 805 018,47 | 0,41 | 1 | 3 352 490 057,57 | 2,29 |
| 9 | GAZP | PJSC Gazprom, JSC | 2,59934 | 23 673 512 900 | 61 535 595 802,1 | 0,5 | 0,6879858 | 21 167 808 053,2 | 14,44 |
| 10 | GMKN | PJSC MMC Norilsk Nickel, JSC | 279,56483 | 158 245 476 | 44 239 869 049,9 | 0,38 | 0,6879858 | 11 565 832 646,1 | 7,89 |
| 11 | HYDR | PJSC RusHydro, JSC | 0,00855 | 426 288 813 551 | 3 642 783 830,91 | 0,19 | 1 | 692 128 927,87 | 0,47 |
| 12 | IRAO | PJSC Inter RAO, JSC | 0,07108 | 104 400 000 000 | 7 420 313 870,75 | 0,33 | 1 | 2 448 703 577,35 | 1,67 |
| 13 | LKOH | PJSC LUKOIL, JSC | 69,45121 | 692 865 762 | 48 120 368 Oil | 0,55 | 0,6879858 | 18 208 371 435,3 | 12,42 |
| 14 | LSRG | PJSC LSR Group, JSC | 8,25292 | 103 030 215 | 850 299 724,15 | 0,42 | 1 | 357 125 884,14 | 0,24 |
| 15 | MAGN | OJSC MMK, JSC | 0,5395 | 11 174 330 000 | 6 028 542 018,66 | 0,16 | 1 | 964 566 722,99 | 0,66 |
| 16 | MGNT | PJSC “Magnit”, JSC | 44,96729 | 101 911 355 | 4 582 677 616,84 | 0,71 | 1 | 3 253 701 107,96 | 2,22 |
| 17 | MOEX | PJSC Moscow Exchange, JSC | 1,42693 | 2 276 401 458 | 3 248 268 643,16 | 0,63 | 1 | 2 046 409 245,19 | 1,4 |
| 18 | MTSS | PJSC “MTS”, JSC | 4,20972 | 1 998 381 575 | 8 412 623 478,93 | 0,45 | 1 | 3 785 680 565,52 | 2,58 |
| 19 | NLMK | OJSC NLMK, JSC | 1,78136 | 5 993 227 240 | 10 676 111 493,4 | 0,19 | 1 | 2 028 461 183,75 | 1,38 |
| 20 | NVTK | OJSC NOVATEK, JSC | 14,38574 | 3 036 306 000 | 43 679 516 570,8 | 0,21 | 0,838198 | 7 688 537 520,43 | 5,25 |
| 21 | PHOR | JSC PhosAgro, JSC | 34,41423 | 129 500 000 | 4 456 642 406,13 | 0,25 | 1 | 1 114 160 601,53 | 0,76 |
| 22 | PIKK | PJSC “Group of Companies PIK”, JSC | 5,38822 | 660 497 344 | 3 558 906 852,95 | 0,18 | 1 | 640 603 233,53 | 0,44 |
| 23 | PLZL | OJSC "POLIS", JSC | 154,34957 | 133 561 119 | 20 615 101 072,8 | 0,21 | 1 | 4 329 171 225,28 | 2,95 |
| 24 | POLY | Polymetal International plc, shares of a foreign issuer | 19,06185 | 470 230 200 | 8 963 459 206,55 | 0,45 | 1 | 4 033 556 642,95 | 2,75 |
| 25 | ROSN | OJSC NK Rosneft, JSC | 4,65716 | 10 598 177 817 | 49 357 382 258,5 | 0,11 | 1 | 5 429 312 048,44 | 3,7 |
| 26 | RTKM | PJSC Rostelecom, JSC | 1,05828 | 2 574 914 954 | 2 724 993 528,1 | 0,32 | 1 | 871 997 928,99 | 0,59 |
| 27 | RUAL | United Company RUSAL Plc, shares of a foreign issuer | 0,35044 | 15 193 014 862 | 5 324 202 999,3 | 0,16 | 1 | 851 872 479,89 | 0,58 |
| 28 | SBER | PJSC Sberbank, JSC | 2,73459 | 21 586 948 000 | 59 031 468 663,3 | 0,48 | 0,6405724 | 18 150 686 187,4 | 12,38 |
| 29 | SBERP | PJSC Sberbank, ap. | 2,50918 | 1 000 000 000 | 2 509 178 932,32 | 1 | 0,6405724 | 1 607 310 770,71 | 1,1 |
| 30 | SNGS | OJSC “Surgutneftegas”, JSC | 0,502 | 35 725 994 705 | 17 934 386 658,6 | 0,25 | 0,9774656 | 4 382 561 503,97 | 2,99 |
| 31 | SNGSP | OJSC “Surgutneftegas”, ap. | 0,51621 | 7 701 998 235 | 3 975 874 742,78 | 0,73 | 0,9774656 | 2 836 984 977,41 | 1,94 |
| 32 | TATN | PJSC Tatneft named after. V.D. Shashina, JSC | 8,1419 | 2 178 690 700 | 17 738 687 263,5 | 0,32 | 0,9115117 | 5 174 086 714,66 | 3,53 |
| 33 | TATNP | PJSC Tatneft named after. V.D. Shashina, ap. | 7,67619 | 147 508 500 | 1 132 302 795,11 | 1 | 0,9115117 | 1 032 107 245,68 | 0,7 |
| 34 | TCSG | Tinkoff Bank JSC | 12,73408 | 119 291 268 | 1 519 064 110,11 | 0,89 | 1 | 1 351 967 058 | 0,92 |
| 35 | TRNFP | JSC AK Transneft, ap. | 2 102,48995 | 1 554 875 | 3 269 109 068,19 | 0,32 | 1 | 1 046 114 901,82 | 0,71 |
| 36 | UPRO | PJSC Unipro, JSC | 0,03662 | 63 048 706 145 | 2 308 904 242,92 | 0,16 | 1 | 369 424 678,87 | 0,25 |
| 37 | VTBR | VTB Bank (PJSC), JSC | 0,0005 | 12 960 541 337 300 | 6 420 192 128,5 | 0,27 | 1 | 1 733 451 874,69 | 1,18 |
| 38 | YNDX | Limited liability company “Yandex N.V.”, shares of a foreign issuer | 36,56681 | 293 527 656 | 10 733 369 600,4 | 0,96 | 0,6879858 | 7 089 029 636,35 | 4,84 |
TOP 10 shares in the RTS index
| # | Code | Company name | Total capitalization, billion $ | Free-Float | Capitalization index, billion $ | Weight | Industry |
| 1 | GAZP | Gazprom, JSC | 55,1 | 50% | 19,0 | 14,6% | Energetic resources |
| 2 | SBER | Sberbank, JSC | 51,9 | 48% | 15,9 | 12,3% | Finance |
| 3 | LKOH | LUKOIL, JSC | 41,9 | 55% | 15,9 | 12,2% | Energetic resources |
| 4 | GMKN | Norilsk Nickel JSC | 39,6 | 38% | 10,4 | 8,0% | Metals and mining |
| 5 | YNDX | Yandex N.V., JSC | 10,2 | 96% | 6,8 | 5,2% | Consumer sector |
| 6 | NVTK | NOVATEK, JSC | 35,8 | 21% | 6,3 | 4,8% | Energetic resources |
| 7 | ROSN | Rosneft, JSC | 42,8 | 11% | 4,7 | 3,6% | Energetic resources |
| 8 | TATN | Tatneft, JSC | 15,5 | 32% | 4,5 | 3,5% | Energetic resources |
| 9 | PLZL | Polyus, JSC | 18,2 | 21% | 3,8 | 2,9% | Metals and mining |
| 10 | SNGS | Surgutneftegaz, JSC | 15,5 | 25% | 3,8 | 2,9% | Energetic resources |
How companies are accounted for
To include a company on the list, a review procedure is carried out quarterly on the 15th of December, starting in December. The composition includes only companies whose shares are traded on the MICEX. Only those companies that occupy the first 50 positions by capitalization are included, i.e. are the most liquid on the market, and at least six months must pass after the IPO on the stock exchange. But the list may be smaller. Sometimes the index committee of the MOEX stock exchange does not include all 50 companies, but reduces them to the required minimum, taking into account the companies' performance. The RTS is balanced, so companies that could negatively affect the dynamics of the index are excluded.
How is the RTS index calculated?
The method for calculating the RTS index is similar to the method for calculating the MICEX index, but with the difference that the main formula contains the cross rate, that is, the price of the quoted share in ruble equivalent. The formula for calculation is presented below:
,Where:
- Icn is a parameter displaying the dollar index ( n is the point in time at which the calculation is made);
- MCcn is the total capitalization of shares at time n ;
- Dcn is the divisor at time n , equal to 128,335,613.6065 at the time of writing. The divisor is not a constant value and is calculated using a separate formula that takes into account the very first indicators and the current situation on the stock exchanges.
How to make money on the rise or fall of the index?
Today there are only two ways to participate in the index movement:
- Using the derivatives market, trading index futures. You can make money on both the growth and fall of the underlying asset
- By purchasing an ETF from FinEx (in this case you can only earn on the growth of the asset)
- There is also a third one, but it is not entirely “true”. On Western exchanges, an analogue of our RTS is traded - MSCI RUSSIA and an ETF based on it called (ERUS).
Moreover, for both methods you will need to open an account with one of the licensed brokers (not to be confused with Forex “kitchens”!).
What do you think about the prospects for Russian markets and the economy over the next year or two? Subscribe to updates and share links to the latest posts with your friends on social networks!
PS I write weekly reports on trading in the derivatives market. If you are interested, you are welcome!
How is stock capitalization calculated?
Capitalization is an indicator that displays the total value of the shares included in the index at the moment. This indicator is also dynamic and depends on how many shares are outstanding and what their value is. A separate formula is used to calculate the total value of companies
- N is the total number of securities issued by the company;
- Pci — the cost of an individual share in USD currency;
- Qi is the total number of shares of the same type owned by a particular issuer;
- FFi is the free-float coefficient, which displays the number of shares in free circulation;
- Wi is a weighting coefficient that shows how much weight a stock has relative to its total capitalization.
How is RTS calculated?
I will not give complex formulas here - I will explain the essence of the calculation.
The index is based on the capitalization of the 50 companies mentioned above. It is calculated as the number of shares outstanding multiplied by the current market value. This is exactly how much, according to investors, Sberbank or Gazprom is worth at a particular moment. As of the date the index was formed, the capitalization of the TOP 50 companies was estimated at $12.666 billion, which corresponded to 100 RTS points.
And then everything is simple. If, let’s say, the capitalization of all companies has grown to $50 billion, then through an elementary proportion we find that the RTS is no longer equal to 100, but to 396 points.
The index is recalculated online every 15 seconds. And the composition of issuers is reviewed once a quarter by the board of directors of the Russian Trading System. In practice, the calculation, of course, looks much more complicated. The formula takes into account the weight of the company and adjustment factors by year (for example, the free-float adjustment factor). But the essence of the calculation remains the same.
Dynamics of the RTS index by year
The table below shows the index values distributed by year. Values are based on year-end closing price.
| Year | RTS index price | Price change |
| 1996 | 201 | 142% |
| 1997 | 397 | 98% |
| 1998 | 59 | -85% |
| 1999 | 175 | 197% |
| 2000 | 143 | -22.4% |
| 2001 | 257 | 79% |
| 2002 | 359 | 40% |
| 2003 | 567 | 58% |
| 2004 | 614 | 7.7% |
| 2005 | 1126 | 83% |
| 2006 | 1922 | 71% |
| 2007 | 2291 | 19% |
| 2008 | 632 | -72% |
| 2009 | 1445 | 129% |
| 2010 | 1770 | 23% |
| 2011 | 1382 | -22% |
| 2012 | 1527 | 11% |
| 2013 | 1443 | -5.8% |
| 2014 | 791 | -45% |
| 2015 | 757 | -4.5% |
| 2016 | 1152 | 52% |
| 2017 | 1124 | -2.5% |
| 2018 | 1069 | -5.1% |
| 2019 | 1550 | 44.9% |
| 2020 (April) | 1129 | -27.1% |
Taking a look at the table, we can find that approximately every 10 years the index experiences a large drop. What is this connected with? According to analysts' observations, the market has a cyclical nature, and every decade there are economic crises that cause a collapse in stock markets to a greater or lesser extent. The last two major crises occurred in 1998 and 2008. It was during these periods that stocks fell the most. But then the market stabilizes and quotes begin to actively grow, which we can observe based on the data presented in the table. Every 10 years, the RTS index showed strong growth: in 1999, 2009 and 2019. The drop in the index in 2022 is due to the COVID-19 pandemic and general panic in global markets, as a result of which investors are getting rid of stocks, hedging funds and moving their capital into lower-volatility assets such as gold and other precious metals, currencies and others.
In theory, over the next two years, provided that the situation with the crisis caused by the spread of the new coronavirus stabilizes, the market can expect a new powerful wave of growth. But this cannot be predicted unequivocally, since the movement depends on many factors, including the country’s economic indicators, such as GDP, inflation rate, indicators of a particular production sector and many others.
Futures on the RTS index. Features of trading, nuances and facts
In this article I will look at the main features of RTS index futures. Its advantages and disadvantages.
The two main exchange indices of shares of the Moscow Exchange are the RTS Index (RTSI) and the Moscow Exchange Index (IMOEX).
Both have the same stock composition. The only difference is that the price of shares of the first index is calculated in dollars, and the second in rubles. Therefore, their schedules are different from each other.
RTS Index from 1995 to 2022
Moscow Exchange Index from 1997 to 2022
In terms of liquidity, RTS futures rank third after Brent oil futures and dollar-ruble futures.
The exchange symbol of the RTS index futures is Ri or RTS.
The futures contract has 4 execution dates: March (month code – H), June (M), September (U), December (Z).
Traded on the Moscow Exchange five days a week from 07:00 to 23:50 Moscow time.
The morning trading session lasts from 07:00 to 10:00 Moscow time. Day session from 10:00 to 18:45 Moscow time. Evening session from 19:00 to 23:50 Moscow time.
The current contract price is 135340 points.
The price step is 10 points, the cost of which is 12.80 rubles.
The amount of guarantee security (GS) is 21,401 rubles per contract.
The size of the guarantee and the cost of the price step change over time.
RTS Index futures are a settled contract, so if you do not sell the futures at the expiration date, the basket of shares will not be delivered to your brokerage account. Only cash will be credited.
- Futures - how they work, players, exchanges, advantages, risks
What does a futures contract on the RTS index consist of?
The RTS index includes shares of 38 largest companies in Russia. We are talking only about those that are traded on the stock exchange. The weight of each company in the index is determined by its current market capitalization.
Sberbank, Surgutneftegaz and Transneft have not only ordinary but also preferred shares in the index. Thus, the total number of securities in the index is 41. The list of the RTS index is revised at the end of each quarter.
The 3 largest companies in Russia occupy 42% of the index weight: Gazprom (14.6%), Sberbank (14%), Lukoil (13.4%).
10 companies occupy 72.8% of the weight of the RTS index.
The weight of companies in the index is distributed across economic sectors as follows:
Oil & Gas ~ 49% Financials ~ 18% Metals & Mining ~ 15% Consumer ~ 10% Telecommunications ~ 3% Electric Utilities ~ 3% Others ~ 2%
Shares of oil and gas companies have the greatest impact on the price behavior of the index compared to other companies. Stocks in several sectors of the economy may be trending downward, but if oil and gas stocks are trading sideways or rising, you probably wouldn't guess from the index chart that many stocks are beaten.
Despite the large bias towards the oil and gas sector, the RTS index is nevertheless diversified across sectors. And this is one of the advantages of trading futures on the RTS index - the absence of risk for an individual company.
On October 11, 2022, Yandex shares fell by -20.4% due to a proposal in the State Duma of the Russian Federation to introduce a bill to limit the share of foreign participation in the company. Yandex shares occupy 6th place by weight (4.9%) in the RTS index.
It is significant that on the same day the Moscow Exchange index decreased by only -0.64% during the day. The RTS index first showed growth, then turned around and ended the day almost unchanged compared to the previous day.
Indices are diversified and therefore less volatile than individual stocks.
Of course, if oil and gas companies began to dive under water, the impact on the RTS index would be greater. But the damage for him would still not be the same as for the oil and gas companies themselves, since the RTS index also contains other sectors. And the shares of these sectors may fall more modestly, or stand still, or even grow.
Dependence of RTS futures on the dollar exchange rate
The RTS index futures price step is 10 points.
Their cost today is 12.80 rubles and it changes all the time, since the cost of a price step corresponds to 20% of the US dollar exchange rate against the Russian ruble on the Moscow Exchange.
In other words, 10 points = $0.2.
If the dollar-ruble exchange rate USD/RUB is 65 rubles, then the cost of 10 points will be 65*0.2=13.0 rubles.
If the dollar-ruble exchange rate USD/RUB is 70 rubles, then the ruble value of 10 points will be 70 * 0.2 = 14.0 rubles.
And here we come to the next interesting nuance.
1000 points of movement at a dollar exchange rate of 65 rubles will be equivalent to:
1000/10*65*0.2=1300 rubles
1000 points of movement at a dollar exchange rate of 70 rubles will be equal to:
1000/10*70*0.2=1400 rubles
Even with small changes in the dollar-ruble exchange rate, the rise and fall of the RTS futures price by 1000 points will not be equivalent. On different days, 1000 points will have different values in rubles.
The ruble value of the price step is unstable due to its peg to the dollar. Accordingly, having earned and lost 1000 points, the amount converted into rubles may differ in your brokerage account.
For comparison: futures on the Moscow Exchange index are not pegged to the dollar. Its price step cost in rubles is constant.
It is worth adding that the futures price for the RTS index consists not only of the price behavior of the basket of shares that is part of it, but also the current price of the dollar-ruble pair on the Moscow Exchange. After all, shares in the RTS index are converted from rubles to dollars.
If we imagine that the prices of all shares are frozen, and the ruble has fallen in price against the dollar and began to cost not 65 rubles, but 70 rubles, then due to currency revaluation we will see a decrease in the price of the RTS index. The opposite scenario will also be true, when the ruble has strengthened.
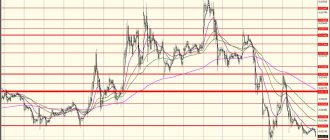
The devaluation of the ruble puts downward pressure on RTS index futures. The strengthening of the ruble provides support for futures on the RTS index. This can be seen in the chart below, where the RUB/USD pair is overlaid on the RTSI index.
Impact of the ruble/dollar exchange rate on the RTS Index
Lowest commissions of any liquid futures
Among the most liquid futures on the Moscow Exchange, futures on the RTS index have the lowest trading costs.
Exchange fees and brokerage commissions are not fixed and are subject to daily changes for all futures. The exchange fee is determined by the product of the settlement price of the futures based on the results of evening clearing and the base futures rate (0.0020% for index futures).
However, let's make some rough calculations.
Costs of trading the most liquid futures on the Moscow Exchange
Please note that in the penultimate column the number of contracts purchased for 100,000 rubles for RTS futures has been rounded up from 4.7 to 5 contacts. To trade 5 contracts, in fact, it would require 107,005 rubles. But if we round the number of contracts down to 4 contracts, then the amount of costs will decrease from 38.10 rubles to 30.48 rubles.
If a trader trades 20 times a month and allocates 100,000 rubles for guarantee, then, provided that the values in columns 4 and 6 in the table above are constant, his costs for the year will be:
20 transactions * 12 months * 38.10 rubles = 9144 rubles per year
The most expensive in this table is futures on Sberbank shares.
20 transactions * 12 months * 71.44 rubles = 17145 rubles per year
All other things being equal, an active trader will pay less exchange fees and broker commissions if he trades RTS index futures.
- Commissions on Moscow Exchange futures (comparison of 10 markets)
GO is more expensive and has higher deposit requirements for trading
The size of the guarantee collateral (GS) for futures on the RTS index is one of the highest among all futures on the Moscow Exchange - 21,401 rubles per 1 futures contract.
GO is 12.5% of the value of the futures contract against rubles and forms a built-in leverage of 1 to 8.
Contract cost in rubles = Contract price in points/Price step in points*Price step cost in rubles
135340/10*12.8=173'235 rubles
Built-in leverage = Contract value in rubles/GO in rubles
173235/21401=8
By depositing collateral of 21,401 rubles, you manage a position worth 173,235 rubles.
Futures on the RTS index are a more expensive market for trading compared to futures on the dollar-ruble and futures on Sberbank shares, both in terms of the size of the GO and the minimum size of the stop loss in rubles per 1 contract.
To trade futures on the RTS index on a brokerage account, you need to have at least 50,000 rubles to withstand a small drawdown of capital, as well as a possible increase in the size of the GO on the part of the exchange, if it is not critical. Otherwise, the trader will not be able to continue trading.
In other words, the account must have more than 2 times more funds than the required GO size to purchase 1 contract.
Also, even if you decide to trade on a very low timeframe, it is unlikely that you will be able to set a stop loss less than 300 rubles per contract. Two cheaper markets were listed above, their stops are 1 contract cheaper and the minimum entry threshold is 10,000 rubles on deposit.
I would like to add that the size of the guarantee on RTS futures changes all the time depending on the level of volatility in the market.
When price movements become very volatile, higher than usual, then to reduce risks, the exchange significantly increases the size of the collateral and, accordingly, the size of the built-in leverage in the contract decreases. In situations of extreme volatility, the size of the GO can be increased several times. In quiet times, the size of the GO is reduced.
The Moscow Exchange is also increasing the size of the GO to reduce risks during long holidays in Russia. Sometimes 1.5-3 times, which is announced in advance on the official website of the exchange.
You should always have a cushion of available cash in your brokerage account to avoid a margin call when your position is forced to liquidate due to an inability to meet margin calls.
Limit of fluctuations in RTS futures prices during the day - bar
At the time of writing, the upper and lower limits for fluctuations in the RTS index futures price are 5.5% higher and 5.5% lower than the current futures price.
If the market has reached the lower price limit, then it is impossible to sell the futures (enter a short position or exit a long position). If the market has reached the upper price limit, then you cannot buy the market (enter a long position or exit a short position).
The ban is in effect until the price rebounds from the limit (bar), or until the limits are expanded by the exchange itself. The exchange will begin revising limits on price fluctuations for RTS futures if the price has been at the level for 15 minutes. If the market reaches the level in the evening session, the limit will be expanded the next morning.
Traders who hold a position against the dominant market movement find themselves hostage to the situation.
On the one hand, they cannot close a position when the market is at the bar. On the other hand, when the limit on futures price fluctuations is expanded, the position will most likely be closed with a large price slippage. It is possible to hit a gap. The reason is a sharp reduction in liquidity. Few people are ready to face the influx of orders from the reverse side of the market.
The worst-case scenario is that after the limits are revised and trading is resumed, the market immediately reaches a new level with a large gap. In this case, the trader will again not be able to exit the market. He will be locked in a position and the resulting losses may be many times greater than those for which he was initially prepared.
At the same time, when the level is reached and the boundaries of the price corridor are revised, the exchange increases the size of the guarantee collateral under the futures contract. This is accompanied by margin calls among those market participants (both bulls and bears) who do not have enough available funds in their account to support the new GO requirements. The forced liquidation of margin call positions adds further volatility to the market.
During one day, the market can reach several levels in a row. The last resort is complete stop trades.
The best way to protect yourself in such extremely rare moments is to stay outside the market. Or use a small position size.
This information is not intended to intimidate, but so that the reader has an understanding of what is happening in such situations.
A convenient tool for long and short the stock market as a whole
The RTS Index represents a broad basket of shares. Thus, RTS index futures can be used to participate in the rise and fall of the Russian stock market as a whole. Both in the short and medium term.
If you are waiting for the stock market to fall, then going short on RTS futures is easier than going short on shares of individual companies.
When trading stocks short, you need to pay your broker for each day you hold the short position. In current conditions, the fee for borrowing shares is 12-20% per annum.
Not all stocks can be shorted. If authorized, the broker may not always have enough shares of a particular company to lend you.
If a company plans to pay dividends and you hold a short position during the shareholder close date, then you, as the short seller, have an obligation to pay the dividend amount to the shareholder.
Also, if you are short a stock, your broker has the right to demand that you close it. For example, he will have a shortage of these papers and will no longer be able to lend them. Such a demand may come at an unfavorable moment for you.
Shorting futures on the RTS index does not have these disadvantages.
Dmitry Boytsov
Market overview
The industries that contribute the most to the index include the energy sector (45%), banking and finance sector (19.4%), mining sector (17.1%) and consumer discretionary sector (10.1%), accounting for a total of 91.7% of the total index weight. Electricity, communications and other sectors are of secondary interest, accounting for a total of less than 10%. This adds some market resilience to the index.
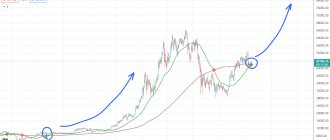
Russian stocks closed 2022 with very strong performance. The leading RTSI index is up nearly 45% for the year, making it one of the world's best-performing markets, thanks to a much stronger-than-expected “Christmas rally” that has pushed the index higher in the past two months. 2022 saw the RTS finally break out of the $900-$1,300 price range in which it had been stuck for almost five years as sanctions were imposed in 2014 following the annexation of Crimea, and the index moved into the $1,500-$1,600 range for the first time since 2012.
After the start of the New Year, the RTS overcame another barrier: the index broke through the $1,600 mark, closing on January 8 at $1,602 for the first time in seven years. The last time the RTS was above 1600, appropriately enough, was Valentine's Day 2013. The highest RTSI reading was recorded in May 2008: 2,489 basis points , after which the index collapsed by more than 70% that year due to the crisis.
In non-crisis years, the market usually grows by at least 20%. This was true during the 2000s, when the Russian market experienced favorable times, which some analysts called a super cycle, with asset prices rising every year, for example, until 2004 after the crisis in 1998, and by more than 20% between 2001 and 2008 for years.
But the second super cycle, which was supposed to start in 2009, never materialized, and instead of the expected bullish rally in 2009 and 2016, the RTS lost its value every year. Economic growth first stalled in 2011 before falling into recession in 2013 when growth fell to zero. In addition, the annexation of Crimea in 2014 and the associated sanctions virtually destroyed all investor enthusiasm.
Why is the RTS falling and what will happen next?
Even a schoolchild can draw an obvious conclusion based on the dynamics of the Russian economic benchmark. The logical chain looks like this:
- The RTS includes shares of the largest Russian enterprises).
- The benchmark is calculated in US dollars. This means that it reflects the real value of our “giants” on the international market.
- The index is growing. Russian companies are of interest to foreign and domestic investors. The country's economy is showing positive dynamics.
- The index is falling. Russian business is becoming “cheaper”, investors’ money is being actively withdrawn, and the economy is sliding downwards.
Interesting fact. Previously, the dynamics of the RTS repeated the dynamics of the MICEX. But in recent years, the curves on the graphs of the two indices have been moving in different directions. This suggests that the devaluation of the national currency today puts pressure on the Russian economy much more than in 2008 or 1998.
For 2022, RTS quotes remained at the same level. For comparison: the famous American Dow Jones index shows positive dynamics throughout its entire period of existence. After temporary falls, he always rose and conquered new heights.
Advantages of the RTS Index
To a greater extent, the dynamics of the index are influenced by the country’s domestic economy, and foreign markets have an influence only indirectly. The RTS index directly depends on the performance of the largest Russian companies. Since the main weight is made up of companies in their energy and financial sectors, given the territory's wealth of natural resources that are not found in other countries, such enterprises can have a predominantly favorable impact. Futures on the RTS are the most liquid instrument on the Russian stock market and at the same time one of the most expensive in the FORTS list.
On the other hand, this characteristic can weaken the country’s economy, since it is strongly tied to these types of resources and sources of the economy. Here we can draw parallels with Greece, which is heavily dependent on tourism, the countries of the Middle East and Venezuela, which are also heavily dependent on oil. As an example, the current situation with the COVID-19 pandemic is perfectly illustrated, when the demand for petroleum products and tourism services has dropped significantly at the same time. Many companies operating in these areas have had to cut prices by half or more to withstand the onslaught. However, the events dealt a serious blow to the stock market, and shares collapsed in a short time. Russia is now part of OPEC, which controls more than 80% of the world's energy resources, so through coordinated efforts, energy countries managed to agree on oil cuts to limit supply and thereby stabilize the market.
Another advantage of the RTS is the global markets of Europe and Asia with high demand for energy products. After the oil transportation to these countries has been adjusted, the cost ratio for constructing pipelines and organizing supplies is reduced. Russia has made economically sound decisions by keeping its most significant and influential energy companies under state control and keeping public debt low. It is important for developed countries to keep public debt low to provide themselves with ample room to maneuver, since public debt will eventually increase as funds are invested to expand infrastructure.
The next advantage is the low GDP per capita combined with a large population. This creates enormous growth potential for GDP for at least the next decade. The development of the Russian economy largely requires labor at a time when technology countries are experiencing an acute shortage of highly qualified specialists.
A few words about the RTS and MICEX
Back in 1995, an alternative to the MICEX exchange was created in Moscow - a platform called the “Russian Trading System”. The key indicator of the site was the RTS index, the online chart of which I will provide below. After the merger of the MICEX exchanges with RTS, the index came under the management of the newly created Moscow Exchange. The main calculations of the index concern stock prices of the 50 largest Russian companies with the largest capitalization.
Unlike the MICEX, the RTS (or RTSI) shows the price of Russian “giants” not in rubles, but in US dollars.
By the way, other RTS are also traded on the exchange. For example, RTS-2 includes securities of second-tier companies. And RTS Standard reflects the dynamics of the fifteen most liquid stocks on the Russian market.
The main RTS includes shares of Sberbank, Gazprom, LUKOIL, Magnit, Surguneftegaz, NOVATEK, Norilsk Nickel, VTB, Moscow Exchange, ALROSA, RusHydro, AFK Sistema, Aeroflot and others. The composition is periodically revised, its current version can be viewed on the exchange website.
The RTS index is heavily tied to the commodity sector. In 2015, oil and gas companies accounted for more than half of the total capitalization. The second significant segment is financial (large banks and financial groups). And the mining of metals, the consumer sector, telecommunications and mechanical engineering are much more modestly represented in it.
Disadvantages of RTS
Russia is known for its reluctance to engage in business cooperation with other countries and for the presence of a large number of political inconsistencies when cooperating with energy companies. As an example, we can again refer to the previous OPEC+ agreement, under which Russia and Saudi Arabia refused to reduce oil production, which led to a price collapse: the price of oil fell to $22 per barrel - a record low in the last 10 years. But in the end, it was possible to agree on a reduction in oil production.
The second disadvantage is the heavy dependence on exports. This applies, first of all, to industrial production and food products. Russia practically does not produce competitive equipment, and many food products are ordered from China due to low prices, since, despite the vast territory, agriculture is developing at a slow pace. In this regard, the devaluation of the ruble in 2014, one of the strongest in history, was able to worsen the situation in the market. That year, the index ended the year 45% lower than the previous year. But a close connection with the dollar can also play in our favor, since when it falls, the index will rise.
How and where to buy the RTS index
The index is traded on the Moscow Exchange (MICEX). To buy and sell the index, you need to purchase a derivative on RTSI: futures , options or CFD (contract for difference). Please note that these contracts belong to derivatives markets, that is, the transaction is opened for a certain period. This can be done through special brokers that provide access to trading in Russian shares. Here is a list of some legal brokers where you can purchase RTS contracts:
- BKS;
- Finam
- Alpha broker;
- Tinkoff Investments;
- Just2Trade.
How has the index value changed over the past 10 years?
Quotes from TradingView
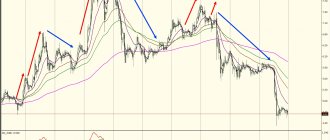
For 10 years (from the end of 2006 to the end of 2016), the RTS both soared and fell painfully. On May 19, 2008, the index was trading at a historical high of 2498.1 points.
In general, 2008 turned out to be the most volatile year for the Russian market. In the fall, the market recorded two records at once: maximum growth (+22% on the day of September 19) and maximum fall (-19% on the day of October 6).
From the “May peak,” RTS plummeted down to 552.88 points by February 2009. In just a few months, the index fell five times in price! “Pushing off from the bottom,” the graph grew with minor adjustments until April 2011. True, it never reached the previous record - the local maximum was only 2130 points.
It is interesting that the confident downward movement of the market began in the spring of 2011, and not with the advent of the fresh crisis of 2014, as many people think. The Ukrainian conflict, sanctions and cheap oil only added further acceleration to the decline. Over six months (from July to December 2014), the RTS collapsed from 1314 to 825 points. And on days of exacerbation it even dropped to 578 points.
Last year the situation began to level out a little. And at the end of February 2018, the market again came close to the 1000 point mark.