Shares of growth companies: for quick money
What are growth companies
Growth companies are companies that increase in value faster than other businesses in the same segment of the economy. Shares of such companies are also growing faster than the market.
For example, Microsoft and IBM are two software companies that are both well-known and stable. But if you look at how the price of their shares changes, you can see that Microsoft’s is constantly growing, while IBM’s growth is replaced by a fall. Microsoft is a typical growth company.
Changes in the value of Microsoft shares in 2017–2021. Source: RBC.
Changes in IBM stock prices in 2017–2021.
Source: RBC. When an investor invests in a growth company, he expects that the shares will rise in price and after some time they can be sold at a higher price. At the same time, dividends on such shares are rarely paid or the amounts are very small, since the business invests almost all its profits in its development. So growth stocks are not suitable for those who want to receive stable passive income.
Important
Shares of growth companies will not necessarily rise in price all the time: the market is dynamic, and no one can guarantee profitability.
Microsoft dividends. It's difficult to make money from them. Source: Investing.com
Key Features of Growth Companies
A company can be called a growth company if it:
- Known to a wide circle of people. For example, Apple, Microsoft - there is no need to introduce their products: anyone knows what an iPhone or Windows is.
- Refers to a fast-growing sector of the economy, for example IT, retail. Sometimes such companies can even create their own new direction, as Tesla did.
- Uses the latest developments in production and releases them to the market.
- Invests almost all profits in its development.
Yandex, Amazon, Tesla, AliExpress, Netflix, Google, Facebook, Mail.ru Group, Visa, Qiwi, Novatek are growth companies. Each company on this list is well-known, belongs to a fast-growing sector of the economy, uses modern technologies and developments, and invests almost all its profits in development.
When to buy growth stocks
Growth stocks are suitable for those who are not afraid to take risks: a rapid rise in the price of securities can be followed by an equally rapid fall. This happened in 2022 with Facebook shares, which fell sharply by 24% immediately after the release of the report. Growth stocks are worth buying if your goal is to grow your capital in the short to medium term.
Risks when buying growth stocks
- A rapid increase in the value of shares can just as quickly be replaced by a fall in price - you can suffer large losses.
- Predicting the price of growth stocks is almost impossible.
- A portfolio containing growth stocks needs to be managed—rebalanced. If this is not done on time, you may suffer losses.
- The price of securities is highly dependent on external factors - any negative news regarding the company can trigger a fall in shares.
Buy or sell: what's happening to Chinese stocks
Read on topic
Portfolio of “Growth Stocks” on the Russian market
“Growth shares” are companies whose business is developing rapidly, operating results and revenue are growing. A distinctive feature is that such issuers, as a rule, do not pay dividends or conduct buybacks, and their debt load is sometimes higher than industry average levels. At the same time, the price of shares of developing companies often grows at a faster pace than the market. It is due to the rise in the market value of securities that the capital of shareholders increases.
There are not many growing companies on the Russian stock market, but in 2022 their number has increased - Ozon, Mail.ru and Headhunter entered the Moscow Exchange.
Let us outline the most notable “growth stories” of the domestic market and their distinctive features.
Yandex
One of the most striking growth stories in the Russian market is Yandex. At the end of 2022, its quotes increased by 92%.
The company's advertising business suffered in the second quarter due to the spread of COVID-19, causing the group's revenue growth rate to fall to zero. However, already in the third quarter there was a recovery in key financial metrics. At the same time, the pandemic gave impetus to the development of Yandex’s digital services, as well as food tech. We can assume that, on the whole, the group went through the difficult 2020 painlessly.
Currently, Yandex shares are valued at a high price relative to their peers in both the Russian and foreign markets. This is partly explained by the decline in financial results in the second quarter of 2022. It is precisely because of the “high cost” of the securities that it is difficult to expect accelerated growth of shares over the medium-term horizon. However, the long-term outlook remains moderately positive.
TCS Group
TCS Group shares are up 80% in 2022. Thanks to its business model, the bank got through the difficult period of the second and third quarters a little better than its industry competitors. The development of the group continued, including thanks to the brokerage segment, which became the beneficiary of lower interest rates in the economy and the mass entry of private investors to the stock exchange. The volatility of the securities during the year was added to by news about the possible sale of the group to Yandex - ultimately the deal did not take place.
The beginning of 2022 for TCS Group turned out to be extremely positive. In January, securities grew by 42% - one of the best results on the market. Positive drivers were the news about the reduction in the voting share of Oleg Tinkov and his family from 84% to 35%. Thanks to the growth of free-float, shares can now be included in various indices, which will lead to an influx of capital and is already included in quotes.
At the moment, there is a possibility that most of the drivers have already been won back and it may be uncomfortable to enter the paper at current levels. Because of this, the upside potential is limited in the medium term. Over the long term, the group's growth and share price rise may continue.
Ozon
Ozon is a new name on the Russian stock market. The company was listed on the Moscow Exchange and Nasdaq in November 2022.
The company's gross merchandise value (GMV) for the third quarter of 2022 amounted to RUB 44.2 billion, an increase of 127% year-on-year, and during the peak season of the pandemic the figure reached RUB 45.8 billion. (+188% y/y). The base of active sellers and the total number of orders on the marketplace continued to grow.
Like most companies in an active growth stage, Ozon is still unprofitable, but at the moment it is much more important for investors that the group’s active expansion continues. Considering the prospects for the development of e-commerce in Russia and the strong position of the online retailer in the domestic market, the long-term view on the stock is positive.
HeadHunter
The recruiting company Headhunter appeared on the Moscow Exchange in 2022; before that, the securities were traded only on Nasdaq.
HH's business was impacted by the pandemic in 2022. Some companies had to cut staff or reduce the number of available positions, which put pressure on Headhunter's operating and financial results. In the third quarter, indicators began to recover; in the traditionally strongest fourth quarter, growth could have continued.
Also important for the group in 2022 was the deal to purchase Zarplata.ru, a platform for searching and posting vacancies, widely represented in Siberia and the Urals. The company was valued at 3.5 billion rubles, HH financed the deal by issuing bonds.
Locally, the acquisition of Zarplata.ru may put pressure on key financial metrics due to lower profitability of the site and an increase in the debt load of the group as a whole. Over the long term, the acquisition will allow HH to strengthen its presence in the regions and gain synergies through the alignment of sales, monetization and marketing strategies.
Mail. ru
Mail.ru received a listing on the Moscow Exchange in July 2022, before which the securities were traded on the LSE. The group went through the pandemic period relatively painlessly - it was helped by the gaming business, whose revenue increased by 32% over 9 months.
At the same time, the shares looked quite depressed at the end of 2022 - securities from the beginning of November to the current moment have lost about 7% against the growth of the Moscow Exchange index by 29%. It is difficult to identify objective reasons for the multidirectional dynamics. Perhaps the quotes are influenced by speculative factors or a major securities holder is exiting the capital of an IT company.
From a fundamental point of view, such a situation is not entirely justified, especially against the backdrop of Mail.ru’s cheapness in terms of multiples relative to the industry and Yandex. It can be expected that as soon as the negative sentiment in the security is broken, the shares may be positively revalued, “catching up” with their growing competitors.
AFK System
AFK Sistema itself can hardly be called a “growth story” in the classical sense. The financial corporation, rather, is cultivating new promising businesses on the Russian market. Thus, in the portfolio of AFK Sistema, growing companies include Ozon and non-public ones: Medsi, Steppe agricultural holding, Segezha Group.
The company's shares soared 88% for 2022. A strong driver was the successful IPO of Ozon. The ongoing deleveraging also had a positive impact on the company - at the end of the third quarter, the net debt of the corporate center decreased by 10% compared to the end of 2019.
At the beginning of this year, the company announced that the next contender for an IPO after Ozon could be the forestry holding Segezha Group. Sistema emphasizes that no official decisions regarding the IPO have been made to date, but if market conditions exist, a public offering could take place as early as 2021. The entry of non-public companies to the stock exchange is usually a positive driver for shareholders, in particular AFK Sistema. This way the business receives a market valuation, due to which the holding’s shares can increase in price.
Beluga
Beluga is one of the largest Russian alcohol companies with growth prospects. At the end of 9 months of 2022, product shipments increased by 11.4%. The most growing segment of Beluga’s business is the VinLab retail chain. Over the same period, its sales grew by 49.9% y/y, LFL sales increased by 23.5%. A notable feature of the network is its high margins - according to the results of the first half of 2020, the gross profit margin was 31.1%, against 22-25% on average for the Russian market.
In the future, the growth of the group and in particular the retail business should continue, which is likely to support Beluga shares.
Rusagro
Rusagro is an interesting “growth story” in the agricultural industry. The company is developing both its own production and is actively working in the M&A market.
At the end of 9 months of 2022, the group’s revenue increased by 10%, EBITDA by 73%, and net profit by 2.4 times. An important point was the increase in prices for sugar, pork, and fat and oil products. Rusagro also increased sales of meat products by 21%, to 53 thousand tons, thanks to the launch of the third stage at Tambov Bacon and an increase in productivity.
Given the group's ongoing development, a moderately positive long-term view on Rusagro shares.
Moscow Exchange
Thanks to the powerful trend of private investors entering the Russian stock market, Moscow Exchange can to some extent be classified as a growth stock. At the end of 2022, the number of individuals registered on the exchange increased by 2.4 times, to 14.6 million people, and active clients by 3.6 times, to 1.4 million people.
The influx of clients is positive for the commission income of the trading platform. At the same time, the entry of “physicists” to the stock exchange is a qualitative long-term trend, so we can expect that the trend will continue in the coming years. Moscow Exchange shares can hardly be called cheap; the valuation is close to fair.
BCS World of Investments
Stocks of value companies: for regular income
What are value companies, or dividend companies?
Value companies are companies whose development prospects the market has not yet noticed. The securities of these companies are cheaper than the shares of competitors operating in the same industry. This is possible, for example, if companies do not promote their brand, invest little in advertising and still produce high-quality products. As a result, value companies have good profits, and they willingly share them with their investors - they pay dividends.
AT&T is one of the undervalued companies. It pays dividends consistently, but the price of its shares is low - $27.4. Source: Investing.com
The point of investing in dividend-paying companies is to buy shares before the price relative to its peers. And at the same time earn money from dividends. It was precisely this strategy that Warren Buffett built his empire on: he looked for enterprises whose prices should objectively be higher and invested in them. Finding value companies is difficult because you have to correctly identify what makes their shares cheaper than their competitors.
Main features of value companies
What is typical for value companies:
- They belong to stable sectors of the economy: construction, mining, banking. The growth of such companies usually does not exceed 10% per year, and the development of the industry itself may even stand still.
- They pay high dividends.
- They occupy a strong position in the market, despite the lack of growth - thanks to this they will strengthen their position in the future.
- Financial indicators are lower than those of competing companies. These indicators are called multipliers. They are calculated using special formulas by analysts and economists. Multipliers can be found in companies’ financial reports; they can also be viewed in brokerage applications and on special resources, such as Smart-Lab or Trading View. Each multiplier has its own designation: for example, P/E shows how profitable a company is. This multiplier is calculated as the ratio of the company's current market value to its net profit. The higher the P/E, the more the company is overvalued. If the P/E is less than 15–20, it means that the stock is fairly priced, and if the P/E is more than 20, it means that the stock is overvalued and may fall in price.
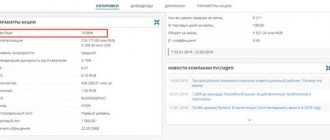
Tesla Motors' P/E is 393, which suggests that the company is overvalued.
Source: Tinkoff Investments application. Ugolnaya, AT&T, Pfizer, ExxonMobil, Johnson&Johnson, Alrosa, MTS Russia, Mechel are value companies.
Who should buy securities of dividend companies?
Value stocks are recommended to be purchased by those who want to become an investor in a stable company and count on constant income.
Risks of buying value stocks
- The underestimation of a company may not be imaginary, but real, related to the company’s policy or its competitiveness.
- No one can predict whether a security will go up, down, or stay the same. The prospects for future earnings from the sale of such assets are very bleak.
- Dividends may be reduced over time, or payments may cease altogether.
To avoid losses, you first need to carefully analyze the company itself, its activities and make sure that there are no prerequisites for the company to go bankrupt or stop paying dividends.
Company life cycle and investor income: what is the connection?
Let's consider the company from the point of view of the theory of Itzhak Adizes, a world expert in the field of business and consultant to such giants as Bank of America, Coca-Cola, IBM, etc.
PHOTO 1
Each company, as it develops, goes through a certain stage of formation. The dividend policy is characterized by such factors as direct payment of dividends, free cash flow, and high EBITDA. Funds are also used for other purposes:
Tinkoff Black debit card
Apply online
- buyback – repurchase of shares;
- closing debts of any nature;
- business expansion or modernization;
- mergers with other companies or their acquisition, acquisition of non-core assets;
- storing funds in bank accounts or on the company’s balance sheet.
These economic characteristics are characteristic of organizations at the maturity stage, when formation and growth are already behind them. During this period, stock volatility is minimal.
Growth stocks are securities of companies going through a stage of active development, when most of the funds are allocated to investments and capacity expansion. Such issuers, as a rule, do not pay dividends, but the price of one security shows stable growth, with periodic falls. With proper business management, such a share will sooner or later become a dividend one.
When we talk about growth stocks and dividend stocks, we are talking about companies at different stages of development. Accordingly, the business analysis itself varies when making decisions on the purchase of securities.
Pros and cons of each strategy
Investing in growth stocks, with the gradual closure of some securities, implies greater risk, but also greater profit:
- At the growth stage, the profitability may overtake the dividend stock, but the beginning and end of the phase are difficult to predict.
- If the company reaches maturity, dividends may be paid. This is a powerful factor in the further increase in the value of the lot.
- Stocks don't always make money.
- If the company's assets are not managed correctly, quotes can fall significantly.
Dividend shares are considered less risky. This is a conservative strategy that provides some speculative opportunities:
- Making a profit regardless of quotes.
- In practice, growth stocks often outperform.
- During the growth phase they bring a rather modest income.
The choice of a suitable asset is based on the investor’s own strategy and vision. The main thing is to fully analyze all the pros and cons in order to accurately decide on a purchase.
How to choose the moment to buy shares
Active traders, conducting several hundred trades per day, trade using various technical analysis indicators. With their help, they try to predict the future movement of stocks or futures based on previous events. Proponents of the classical theory of investment are skeptical about these attempts - results in the past never guarantee their repetition in the future.
However, technical analysis should not be completely discounted. With its help, long-term investors can determine the most opportune moment to buy fundamentally undervalued stocks selected for their portfolio or make decisions to sell securities. What to focus on? We have selected the main technical analysis indicators that can be useful for long-term investing.
Moving averages
Advertising on Forbes
Moving average or moving average line is a graph of the arithmetic average price of shares over the last few days (various numbers of days are used - 7, 14 and even 200). With its help, an investor can assess the trend in the market - the longer a stock grows, the more actively the moving average line begins to follow it. When the price chart crosses the moving average from bottom to top, it is interpreted as a signal to buy. If the stock price crosses the line from top to bottom, it is a signal to sell. This indicator allows you to predict price behavior with high probability and is used in all trading platforms (for example, in the QUIK trading terminal). Moving averages are a simple and fairly reliable, although not very accurate, indicator.
Support and resistance lines
The moment to buy fundamentally attractive stocks can be determined using support and resistance lines. If the stock price has been fluctuating within certain limits for the last few days (for example, from 90 to 110 rubles), then you can limit the chart to two straight lines - support (lower limit of the curve) and resistance (upper limit). These two lines form a corridor, which can be horizontal, or directed up or down. If the stock is trading closer to the upper limit of the corridor, it may be worth holding off on buying. But a sharp breakdown of this corridor along the upper border means that the price will rise, and shares should be bought.
Bollinger Bands
This indicator is similar to the previous two. Four charts are displayed on the trading system screen. In addition to the price, this is a moving average and two corridor lines, spaced from the average by two standard deviations in each direction. In other words, the same corridor, only calculated using simple mathematical formulas. A narrowing corridor means an upcoming sharp change in stock prices. If the price chart touches or crosses the border of the upper or lower envelope line, this indicates a strong price deviation in one direction or another and a correction is expected. That is, touching the upper border of the corridor can be interpreted as a signal to sell, and touching the lower border as a signal to buy.
Relative Strength Index
Another frequently used indicator is the relative strength index (RSI). It is quite convenient to use to determine when to purchase securities for your portfolio. This is a chart that is calculated based on the rise and fall of the stock price over the past few days or months. The unit of measurement is percentage. If the indicator value is in the lower zone – from 0% to 30%, this means that the stock has not grown for a long time and may be oversold, it’s time to buy. If the RSI is in the upper zone - from 70% to 100% - this means that the securities have recently grown for several periods in a row - a correction is possible and we should expect a fall in the rate. This is a very simple and understandable indicator that can be used not only by active traders, says Elena Kozhukhova, analyst.
Figures
Stock price charts from time to time “draw” a certain repeating silhouette, which is interpreted by traders in one way or another. For example, a head-and-shoulders silhouette that looks like three peaks, the central one clearly standing out above the other two, is called a trend reversal figure. After it, it is believed that the value of shares begins to fall. The same applies to double top or double bottom patterns. If twice a stock tries unsuccessfully to break up (down) a certain price level, it is a sure sign that after that the price will fall (rise).
Another figure is the “flag”, which looks like a slight decline in shares on a growing trend. After the “flag,” according to supporters of technical analysis, stocks usually rise. Such figures can be seen on any period of time: hourly, daily or monthly. By seeing such a figure, you can guess when the price of a security will go up or down.
Advertising on Forbes