A bond yield curve is a graph showing the percentage yield of debt securities as a function of their maturity. Usually there is a comparison of bonds of one issuer (for example, government securities) or several, but belonging to the same sector (financial, oil, metallurgy).
In simple words, an investor can look at the chart to assess the attractiveness (profitability) of certain securities and choose more profitable ones for purchase.
The classic bond yield curve can have two forms:
- normal or classic;
- inverted.
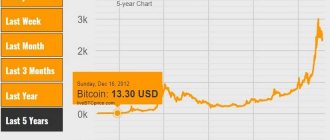
Normal yield curve
The longer the maturity of bonds, the higher their yield. This is due to the fact that investors buying long-term securities (5-10 years and above) bear higher risks compared to holders of short-term (1-3 years) securities. Increased risks are associated with uncertainty in the future. This comes with a risk premium in the form of a slightly higher return.
The graph is typical for a healthy economy. When participants expect further acceleration of economic development and rising interest rates in the future.
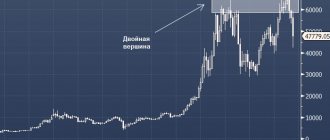
Inverted yield curve
Typically, this picture can be observed at the time of financial crises and (or) the expectation of lower interest rates. At this time, there is a demand for “short” money.
In such a situation, you can purchase long-term securities and fix the current profitability for many years.
High yields on short bonds are a temporary phenomenon. And at the end of their life, if the interest rate falls, it will no longer be possible to invest money at the same interest rate. But owners of long-term securities, losing in profitability in the first years of ownership, gain in the long run.
A small example from reality. Bond yields directly depend on the Central Bank rate. Just like bank deposits. If the Central Bank raises the rate, then issuers will be forced to give higher yields when issuing new bonds. The yield of securities already traded on the market will be adjusted after the Central Bank changes the interest rate. To match the exchange average.
How can the yield of already issued securities change? Due to changes in market value.
The dependency is as follows:
- when the Central Bank rate increases, the market value of bonds decreases;
- When the interest rate decreases, the market price of bonds increases.
When, during the crisis, the Central Bank raised the interest rate by 1.5 times to 18%, new bond issues, focusing on it, were forced to set a similar yield. And securities with a yield of 15-20% per annum were placed on the stock exchange. Over time, each new issue yielded a higher coupon rate.
In theory, old issues with low interest rates are no longer needed. Why buy securities with a yield of 10% per annum when there are bonds of the same issuer, but giving 1.5 times more profit.
To compare with the current yield, the market price of old securities begins to decline. And while the Central Bank rate was rising, bond prices were falling.
After some stabilization, the Central Bank began (and continues) to systematically reduce the interest rate. And what do we have on the market?
New securities are issued each time with a lower yield. And old issues are gradually becoming more expensive.
Using government bonds as an example. During the time the Central Bank increased the interest rate, paper quotes decreased by almost 2 times. And although the owners received fixed coupon payments (7% of the face value of 1,000 rubles), the profitability was much lower compared to new issues.
When the Central Bank begins to lower the interest rate, the price of securities begins to gradually rise. The coupon we pay to paper holders is beginning to approach the market average. And the market price has almost reached pre-crisis values.
If the Central Bank rate continues to be reduced, we will see a further increase in the market value of OFZs.
Summary
2020 was a year of boom in the ruble bond market. Since the beginning of the year, the market has increased by 7% and reached 11.32 trillion rubles. The Bank of Russia's soft monetary policy contributed to a decline in yields to historical lows for all categories of issuers - the most significant drop could be observed for the VDO segment, whose yields fell by 200 bps on average. n. for the last 12 months. At the same time, low deposit rates brought more than 5 million clients to the stock market, who brought brokers more than 1.5 trillion rubles.
In such conditions, first-tier borrowers were able to reduce the cost and lengthen their loan portfolios, including by replacing foreign currency debts. But, according to the agency, the activity of issuers from the sphere of small and medium-sized businesses (SME companies) deserves special attention. This sector has already served as a full-fledged growth point for the bond market since 2022; it is here that the majority of new issuers appeared in both 2020 and 2019.
The SME issuer segment must overcome a number of childhood illnesses that we believe could cut them off from retail investors' money and prevent companies from moving into the higher echelons of low-rate borrowers. Such key limitations now include low transparency of companies, an unsatisfactory situation with the quality of reporting and the lack of widespread use of IFRS standards, low rating coverage of small issuers, as well as distortions in risk assessment by investors associated with the classification of issuers in the VDO sector.
The Russian debt market has defeated the coronavirus. The Russian bond market greeted 2020 with positive dynamics, which could be observed throughout 2022 - the share of non-residents was at near-peak levels, amounting to 32%, the easing of the monetary policy of the Central Bank of the Russian Federation contributed to a progressive decrease in yield rates and an increase in placement volumes both from the outside Ministry of Finance, and from corporate issuers. All the prerequisites were formed for the continuation of positive dynamics, however, the global economic crisis caused by the outbreak of the Covid-19 epidemic served as a serious test for both the Russian bond market and world stock markets.
The main blow to world markets came in the period February–March 2020, when it became obvious to market participants that the coronavirus infection, and with it restrictive measures, would inevitably spread beyond China. Stock indices of developing and developed countries showed double-digit rates of decline during this period.
Over 30 days, the MSCI aggregate stock price index for Russia showed a decline of 41%, which is slightly higher than the decline for developed (-33%) and developing (-31%) countries. The drop in indices for Russia turned out to be especially significant due to stress in the oil and gas industry, where during this period the price of Brent oil fell to $27 per barrel. – the minimum level over the past 10 years.
The Russian OFZ segment also reacted strongly to the development of the epidemic - for the period from the beginning of 2022 to the peak of the decline in March of this year, the yield curve showed an upward shift in all its sections. At the same time, the medium- and long-term sections of the curve were most actively sold off. If in the period up to 1 year yields increased by 70-137 bp, then in the period 3-7 years one could observe an increase in quotations by 190-200 bp. year to date.
The readiness of the Russian economy for a global recession turned out to be higher than in many other developed countries of the world. The peculiarities of the Russian economy played into its hands - the limited integration of the Russian Federation into the world economy against the backdrop of a high share of the public sector allowed it to be among the largest countries in the world whose economies suffered less during the first wave of coronavirus. Data on GDP growth rates in the second quarter of 2020 show that the fall in Russia's GDP was not as dramatic as in other countries of the world.
Table 1. The Russian economy demonstrated the least significant rate of decline in GDP among most developed and developing countries
| GDP growth rate in Q2. 2022 (in annual terms), % | Maximum Credit Rating from Moody's/S&P/Fitch | |
| USA | -9,1 | AAA |
| EU | -15,0 | AAA |
| Germany | -11,3 | AAA |
| Great Britain | -21,7 | A.A. |
| Brazil | -11,4 | BB |
| Russia | -8,5 | BBB |
| India | -24,1 | BBB- |
| Türkiye | -9,9 | BB- |
| Mexico | -18.7% | BBB+ |
| Colombia | -15.7% | BBB |
| China | +3.2% | A+ |
Source: Bank of Russia, Expert RA
At the time of the aggravation of coronavirus infection in March and at the end of October, the level of real interest rates in Russia looked high relative to the levels of developing countries.
In terms of the ratio of the credit quality of the Russian Federation, the proposed yield on government securities and the resilience of GDP to the current crisis, Russian bonds looked attractive in comparison with other countries with economies in transition. This made it possible to limit the outflow of foreign investors from the Russian debt market, and, accordingly, smooth out the decline in prices of Russian bonds, despite the general sentiment of global investors to move away from risky assets in favor of safe ones.
By April 2022, the share of non-residents in OFZs amounted to 32%, remaining at the level of the end of 2022, when the Russian debt market as a whole was experiencing upward dynamics. By October 2022, the share dropped to 27% due to worsening geopolitical risks associated with EU sanctions and uncertainty around the US elections. Also, the decrease in the share of foreign investors was due to the nominal increase in the volume of OFZ in circulation, which was not kept up with the influx of foreign capital.
In response to the consequences of the coronavirus epidemic, in order to stabilize the situation on stock markets in 2022, the Bank of Russia began to more aggressively reduce the key rate. If for the entire 2022 the rate was reduced by 125 bp. p., then over the 10 months of 2020 the regulator lowered the rate by 200 bp. p. to a historical minimum for the entire history of modern Russia of 4.25%.
The implementation of an expansionary monetary policy has partly led to increased inflation risks, which, in terms of real interest rates, is gradually pushing real deposit yields into negative territory. This situation forced private investors to withdraw deposits and enter the stock market in search of profitability.
Over the past 12 months, by the end of September 2022, the number of registered clients on the Moscow Exchange more than doubled and exceeded 11 million people. The number of active clients also showed upward dynamics, more than tripling over this period, from 306 thousand to 1.059 million people. Average monthly transaction turnover among the top 10 market operators increased by 33% over the year, amounting to about 16 trillion rubles.
In the year to October 1, 2022, the number of investors in this category grew by the same amount as it grew in the 20 years from 1999 to 2022.
The reduction of the key rate of the Central Bank of the Russian Federation to historical lows, as well as an unprecedented influx of funds from individual investors, supported the growth of the corporate debt market and put pressure on interest rates. Over the 9 months of 2022, the growth in the number of new corporate bond issues was 25% more compared to the 9 months of 2022.
After a surge in yields in March 2022, public debt rates stabilized and continued to decline. At the same time, spreads to risk-free yield levels looked different for issuers of different quality categories.
Market conditions made it possible to significantly reduce the cost of funding for all market participants.
For issuers of the 1st and 2nd tiers, a downward trend could be observed throughout the year. This was especially pronounced for issuers with a rating of ruAA- and higher.
Starting from the end of June 2022, fluctuations in debt raising rates and OFZ spreads were minimal for the selected categories of issuers. Some widening of credit spreads could be observed for issuers with ratings in the range 'ruA+' – 'ruBBB' from 100 bps. p. in January 2022 to 160 b. by the end of October. The widening of spreads is explained by the return of the geopolitical premium to the Russian market, as well as the desire of issuers to extend the duration and increase the volume of transactions, slightly increasing the premium to risk-free rates, but maintaining the cost of financing at record low levels.
A different picture can be observed for companies belonging to the high-yield bonds (HYB) segment, which mainly consists of representatives of small and medium-sized businesses.
The dynamics of VDO yields was similar to the dynamics of yields of securities of large issuers, however, the spread to OFZ for such categories of issuers showed a more active decline, which was facilitated by the influx of individual investors.
Today, the SME segment is formed by issuers without ratings, or by companies with ratings at the ruBBB level and below, while many companies in the segment raise funds at the level of rates issued by ruAA category issuers, which they paid two years ago.
We consider the SME sector to be key because this is where new names are emerging, where physical investors are most active, and where the foundation is being laid for increasing the diversification of the Russian bond market and its liquidity. According to our calculations, if in 2018 the issuers of the segment carried out 18 debut transactions, then in 2019 their number increased to 41; over the 10 months of 2022, about 30 debut transactions were carried out. According to the Moscow Exchange, as of 9 months of 2022, individuals already accounted for about 17% of the volume of placements of corporate and exchange-traded bonds and 11% of the volume of trading on the secondary market, respectively. If just 2 years ago the order book contained about 2-3 applications from individuals with a share in the total placement of about 0.5-1%, then in 2022 it was possible to observe transactions where, with an placement of 5 billion rubles, demand from the outside individual investors amounted to more than 4 billion rubles, and the number of applications was measured in hundreds.
New retail investors are a big liability for the market, which in an unfavorable scenario can destroy it. VDO issuers bear high risks, which yesterday's depositors cannot fully assess and correlate with the profitability that should accompany the risk. At the same time, a situation where the coupon exceeds 2 or even 3 key rates reduces the motivation for critical thinking and a comprehensive risk assessment. Opinion leaders in this segment are either applications of the largest brokers with their recommendations, or ordinary users of thematic chats and telegram channels, who are not always objective in their judgments. The situation is improved by unlimited liquidity in the scale of issues and low refinancing risks even for the most problematic borrowers: by adding a couple of percent to the rate, money can almost certainly be raised, and in larger volumes compared to previous issues. Profitability as the key and only driver of the market has already laid down a number of “childhood diseases” in its development, without curing which the market will not reach a qualitatively new level with billion-dollar placements, lower rates and investor demand from financial institutions. The market risks getting stuck in its current position and, under pressure from the Bank of Russia, limiting the risks of unqualified investors, losing access to refinancing.
Yield to maturity, YTM
View this article in PDF
Determination of yield to maturity
Yield To Maturity (YTM) is the yield that a buyer of a bond will receive if he purchases it today at the market price and holds it until full maturity, that is, he will receive all cash payments on coupons and the final payment of the bond's face value.
Yield to maturity is usually the main indicator of a bond's performance.
Yield to maturity is calculated as the internal rate of return on all cash flows associated with the purchase of a bond.
Yield to maturity and other types of returns
The need to use yield to maturity in bond analysis is determined by two factors:
- Income from investing in a bond is usually obtained not only from the payment of coupons, but also from the difference between the current price of the bond and its face value, which will be paid at the end of the term. Moreover, there are zero-coupon bonds that generate income only due to the difference between these prices.
- The bond can be purchased not only at the beginning, on the day of issue, but also at any other time. This means that the time until the next coupon payments may vary and may not amount to the entire coupon period.
Because of these features, only YTM can demonstrate to an investor the expected return of a bond. However, there are two other yield measures found in bond data.
The coupon yield shows the ratio of the amount of coupons paid (i.e., interest on the bond) to the face value of the bond. Typically, bonds have a semi-annual or annual coupon payment schedule. The coupon income in any case uses the amount for the full year.
For example, if a bond with a par value of 1000 rubles. A coupon of 25 rubles is paid twice a year, then the coupon yield of the bond is (25+25)/1000 = 5%.
Current yield is the ratio of annual coupon payments to the current market value of the bond.
For example, if in the previous example the bond now has a market price of 900 rubles, then its current yield is (25+25)/900 = 5.56%.
Calculation of yield to maturity
To calculate the yield to maturity in Excel, there is a function INCOME (in the English version - YIELD) , however, this function cannot take into account the situation when a bond is purchased in the middle of the coupon period, in addition, for some bonds the coupon rate may change.
Therefore, it would be most correct to consider the yield to maturity as the IRR of all cash flows, that is, as a solution to the equation:
In this formula, CF is the payments on the bond, including both coupons and par value redemption. Time is symbolized here as t , but the application of this formula differs from the basic IRR equation since payment increments are often 6 months and the first period may have its own duration if the bond was purchased in the middle of the period.
In practice, this means that the VSD() function is not used YTM . Instead, each payment is given a date, and then the IRR is calculated using the NETINDOH() , which takes the exact payment dates as its second parameter.
An example of such a calculation is shown below:
We publish such articles regularly. To receive information about new materials, as well as keep up to date with training programs, you can subscribe to the newsletter. If you need to develop specific skills in investment or financial analysis and planning, check out our seminar programs.
“Childhood diseases” of the new wave of issuers
Analyzing the placement practice of small and medium-sized issuers, in addition to the natural financial risks that are associated with the small size of companies and increased sensitivity to any shocks, we note extremely low information transparency, quality of reporting, corporate governance and systematic regular communication with investors. It is in this area, according to the agency, that a breakthrough is needed. It is worth noting that over the past year there has been noticeable progress in terms of ensuring greater transparency in the segment of small and medium-sized issuers thanks to the efforts of market infrastructure participants. Rating requirements for listing on the Moscow Exchange have been introduced, encouraging issuers to disclose even low ratings; placement organizers are promoting the expansion of the practice of preparing and disclosing reporting under IFRS; the Exchange's inspection procedures, as well as work with rating agencies, are pushing issuers to more clearly structure their business and increase transparency. Nevertheless, there is still significant room for improvement in all these areas, and distortions in the issuer’s demonstration of its risks and their assessment by investors are large.
Information transparency is still low. The minimum permissible disclosure of information in accordance with the law does not allow a full assessment of the issuer's risk. Without a complete understanding of the company, its business risks, financial risks and governance risks, investors may be asking for an unnecessarily high premium that could have been avoided. Many issuers are not mature enough for IFRS reporting and working with good auditing. Almost no one in the sector publishes non-financial operating indicators of their activities. In cases where the issuer operates in a group with one or more related legal entities and publishes only its own individual statements under RAS, investors do not have the ability to analyze the entire perimeter of the group and correctly assess the debt. Due to a lack of understanding of intragroup flows, an investor may demand a higher premium, but this level of analysis may not be available to retail investors, which means the issuer may not pay extra for the risk.
Difficulties in determining profitability. An analysis of the bond market map by credit quality categories shows that the segment of VDO issuers is a market without rules.
When analyzing the yield curve of first-tier issuers, you can see the normal slope of the curve, which runs parallel to the benchmark – the OFZ yield curve. Quotes are distributed evenly along the entire curve and are characterized by minor deviations from it. The level of interest rates of companies fluctuates slightly - at around 1 percentage point, depending on the specific company, term and level of credit rating. Using the yield map of 1st tier issuers, investors and issuers can easily understand what rate a particular company with a rating of ruAAA – ruAA+ can expect.
When analyzing the market map of the VDO segment, which is largely formed by small and medium-sized businesses, a different picture can be observed.
Chart 13 shows the bonds included in the Cbonds CBI High yield aggregate yield index, which includes the most liquid bonds of the VDO segment. The market map of the VDO segment and unrated bonds, in particular, are characterized by a lack of consistency in terms of the distribution of yields to maturity. Quotes are unevenly distributed, which makes it impossible to construct a representative yield curve for unrated bonds. Over a period of 1–1.5 years, the difference in yield reaches more than 600 bp. p. between issuers, or almost 1.5 key rates of the Central Bank of the Russian Federation. In the complete absence of a reliable benchmark, the investor has a very limited set of data to determine the fair levels of profitability of a particular unrated security, so he is left to make a decision only based on his own greed and a sense of acceptability of the rate.
Low rating coverage of SME issuers. The segment of securities of SME issuers is poorly covered by ratings: 41% of the market does not have credit ratings. Because of this, there is largely such a dispersion in the levels of interest rates for one sector with a fundamentally similar profile of issuers.
According to the agency, the problem of low rating coverage contributes to the underestimation of the risks of unrated issuers and the overestimation of issuers with ratings below the ruBBB+ level, but close to it. We consider the ruBBB+ level to be the starting point for securities in the “investment grade” category, since it is from here that issuers have access to a wide range of institutional investors, as well as the opportunity to get into a premium listing. At the same time, many bonds with ratings in the ruBBB category are traded at a level similar to other securities in the VDO segment without ratings. The same situation is observed for issuers of the ruBB category. We believe that this situation is formed by the fact that companies with ratings of the ruBB and ruBBB categories are in the VDO segment. Due to receiving the label “VDO issuer,” which includes unrated securities, issuers may be biased by investors with profitability requirements related not to credit risk, but to the average level of profitability familiar to the VDO sector. Securities with credit ratings included in the VDO segment are perceived by investors in the same way as securities of the same segment without a credit rating, in which there may be significantly more hidden risks.
What does a yield curve tell an investor?
- Quick analysis and search for profitable offers. The yield chart allows you to identify undervalued securities from the total mass of those traded on the market. When there are several dozen or even hundreds of offers in the list of available papers, it is very difficult to compare them. Especially considering that they all have different yields and maturities. Looking at the profitability chart, the investor sees the whole picture.
- The slope of the curve tells the investor which security is better to take at the moment. During a period of rising interest rates (normal yield curve), it is better to take short securities. Since “new” securities entering the stock exchange will have a higher yield. And “old” bonds will lose value over time.
- If there is a downward trend in interest rates (inverted curve), it will be more profitable to invest in long-term securities, fixing the current yield. Additionally, if the overall percentage of return on the market decreases, the investor will receive a profit due to the increase in the market price of his securities. Ideally, when rates stop falling, it is better to sell all assets (much above par value) without waiting for repayment. And buy short securities with current yields.
How can issuers reduce risk premiums?
We believe that all participants in the market infrastructure should contribute to increasing the information transparency of issuers, introducing the practice of a systematic approach to corporate governance, structuring business by issuers and expanding rating coverage. In connection with the entry of issuers from a group of companies into the bond market, the preparation of IFRS statements before placement is also becoming critical.
During initial offerings, there is a practice of conducting pre-marketing, during which meetings are organized with investors, where company managers or owners make a presentation on it, describe the strategy, market positions, operational and financial indicators, features of corporate governance, and sources of repayment of the bond issue. This increases the level of integrity and openness of the issuer in the eyes of the investor and forms an effective system of communication with investors.
In order for investors to update their bond pricing parameters in accordance with the company's results, such meetings could be held regularly, without tying this event to one specific transaction, as is the case among many issuers.
Until the laws of higher echelons of the debt market and pricing, linked primarily to the assessment of credit risk, do not work in the segment of small and medium-sized issuers, the VDO market will not be able to overcome its reputation as unacceptably dangerous for retail investors. Expanding rating coverage and publishing the full risk profile of issuers, especially those with low ratings, in releases from rating agencies should help improve the current situation. On the one hand, the market map will be streamlined and more reliable issuers will begin to pay an adequate rate compared to low-rated ones. On the other hand, the professional community will receive a powerful argument in dialogue with the regulator about the transparency and accessibility of issuer risk assessments for any, even unqualified, investors. Based on this, it will be possible to limit the risks of “physicists” through available limits linked to rating levels, and not through access to the market and classes of instruments.
We believe that such steps will make it possible to interest institutional investors in participating in transactions with companies below the ruBBB+ rating, while, in our assessment, the entry of financial institutions into the segment of more profitable securities with low ratings will reduce the rate of return for issuers.