olegas Dec 10, 2022 / 309 Views
Every person in our time, one way or another, has come across such a concept as stock indices (stock indices). Even if his line of work is far from the stock market, he has probably heard such concepts as the Dow Jones index, RTS or MICEX at least once in his life. We will now talk about what stock indices are, what types of them exist, why they are needed, and how to trade them.
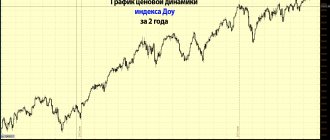
Dow Jones Industrial Average chart
First, a little history. Here it would be fair to mention the creator of the first stock index, American journalist and financier - Charles Henry Dow. In 1884, he developed the Dow Jones Transportation Average, which included stocks of America's major transportation companies. At the time of its creation, the index included shares of eleven companies; currently it includes shares of twenty companies.
The second index created by Charles Dow, the Dow Jones Industrial Average, gained the most popularity. It includes shares of the thirty largest industrial companies.
Definition and Explanation
A stock index is an indicator of the state and dynamics of the securities market. By comparing the current index value with its previous values, you can evaluate the behavior of the market, its reaction to certain changes in the macroeconomic situation, various corporate events (mergers, acquisitions, stock splits, resignations and appointments of leading managers), and speculative processes.
Depending on which securities make up the sample used to calculate the index, it can characterize the market as a whole, the market for a certain class of securities (government obligations, corporate bonds, shares, etc.), the industry market (securities of companies of the same industries: telecommunications, transport, insurance, Internet sector, etc.).
Comparing the dynamics of various indices can show which sectors of the economy are developing at the fastest pace. An index may represent a national stock market as a whole or a specific trading venue within that market (for example, a stock exchange index).
Dow Jones (DJIA)
This is perhaps the most famous and oldest of all existing indexes. It was first used more than a century ago. The number of companies whose shares were taken into account in calculating the value of this index has changed several times over time. So, for example, if in $1896 only $13$ of companies appeared in this indicator, then in $1916$ there were already $25$, and from $1928$ to the present day the Dow Jones index includes share prices of $30$ of the largest companies United States of America. This index, in fact, represents the arithmetic average value of shares of the largest US corporations.
Finished works on a similar topic
Coursework Stock indices 400 ₽ Abstract Stock indices 240 ₽ Test paper Stock indices 210 ₽
Receive completed work or specialist advice on your educational project Find out the cost
In addition to the main indicator, the values of the Dow Jones indices are also calculated for individual sectors of the US economy, for example:
- Dow Jones transportation indicator
- Dow Jones utility indicator
- composite index based on the value of 65 shares of various companies
- other stock indices
World stock indices
Currently, there are many stock indices that are classified according to various criteria. For example, these are indexes such as:
Jones Industrial Average (DJIA) Created by Charles Henry Dow in 1884. Its calculation was based on quotes from the 11 largest US transport companies at that time - the index was called the Dow Jones Transportation Average. A couple of years later, the Dow Jones Industrial Average appeared, which united the main US industrial companies. The DJIA currently shows the average stock price movement of the 30 largest US industrial corporations.
The S&P is published by Standard & Poor's (S&P) in two versions - 500 and 100 stocks. This index is considered more accurate than, for example, the DJIA because it represents the stocks of more corporations. Each company's shares are also weighted by the value of all shares.
NASDAQ (National Association of Securities Dealers Automated Quotation) provides insight into the situation in the US high-tech market. NASDAQ is one of the three main US stock exchanges (besides AMEX and NYSE). Founded in February 1971 and located in New York. Today, shares of more than five thousand high-tech companies are traded on the NASDAQ exchange. The most well-known indices here are the NASDAQ 100 and NASDAQ Composite.
DAX (DAX 30) was introduced in 1988, and is now the main stock exchange index in Germany. Its calculation involves the prices of shares of thirty top companies from different sectors of the German economy.
FTSE (FOOTSIE, “Footsie”). The FTSE 100 Index began calculation on January 3, 1984. Takes into account stock quotes of 100 companies with maximum capitalization and included in the list of the London Stock Exchange (LSE) - the largest stock exchange in Europe, which has been operating since 1801.
Nikkei is considered the most popular Japanese index. Calculated as the arithmetic average of the stock prices of 225 companies on the Tokyo Stock Exchange.
The Hang Seng is Hong Kong's main capitalization-weighted index. Calculated based on stock quotes of 33 companies, the capitalization of which is about 70% of the Hong Kong Stock Exchange.
MICEX and RTS are 2 stock indices that include the 50 most liquid and largest companies in Russia. The index includes such giants as Gazprom, Rosneft, Lukoil, Sberbank, Magnit, etc.
History of the origin of indices
The very first index was invented by Edward Jones and Charles Dow. It included 12 of the largest enterprises in the United States. The index was calculated quite simply: the arithmetic mean of the composition of the companies included in it. And although since then the parameters for defining this index have undergone many changes, as has the number of companies included in it, at the moment it remains one of the most popular in the world. You've probably heard about it - the DOW JONES index.
Requirements for information used in calculating stock indices.
Any formula will be useless if unreliable or incomplete data is entered into it. For reasonable use in calculations, information must meet the following criteria:
- Sample size. It is advisable to use a sufficiently large number of companies when calculating the index, which makes it possible to reduce the likelihood of random deviations in the value of securities of individual companies relative to the market average influencing the final result.
- Representativeness of the sample. The list of companies whose securities are included in, for example, an industry index must be sufficiently complete for the index to adequately reflect the state of a certain segment of the economy. In addition, in order for index changes to correctly reflect changes occurring in the market, the distribution of issuers by capitalization size and industry must correspond to the distribution of the market as a whole. The use of computers made it possible to begin calculating an index for all stocks traded on a particular market, without resorting to some sampling.
- Weight. It is desirable that the value of the securities included in the index have a weight proportional to their influence on the stock market as a whole.
- Objectivity of financial information. It should be taken into account that the stock index is calculated on the basis of publicly reported information on changes in prices for financial instruments. Most indices are calculated throughout the trading day, with updated values appearing at short intervals.
How are stock indices calculated?
The calculation of stock indices may involve various mechanisms. Initially it was just the arithmetic average. But such a calculation did not give an accurate idea of the market movement. All companies differ from each other in capitalization, and each of them should influence the country's economy in different ways. Therefore, at the moment, other methods of forming indices are used: (simple and weighted average, arithmetic and geometric average, and others). Each index has its own calculation mechanism.
The calculation of stock indices is carried out either by rating agencies or stock exchange agencies. The name of the index basically consists of an abbreviation and sometimes a number indicating the number of companies included in the index.
Introduction
There are many economic indices that are used to assess the intensity of changes in the most important socio-economic phenomena and processes, for example: GDP, investment in fixed assets, exchange rates, etc. Indices are among the most important general statistical indicators.
This course work is devoted to stock indices, which are general indicators of the dynamics of securities prices and are calculated by exchange or specialized firms.
The relevance of this topic is beyond doubt due to the fact that stock indices play a huge role in the stock market. It is indices that make it possible to analyze the state of the stock market in past periods of time, to identify certain trends on the basis of which forecasts for the future can be made. Based on exchange (stock) indices, one can also judge the state of the economy of the entire country. Stock indices allow investors to assess the state of their own securities portfolio.
The history of stock indices in the world goes back more than one decade. The very first stock indicator was developed and used at the end of the 19th century. In 1884, in the United States, Charles Dow began to calculate the average of changes in the market prices of shares of the 11 largest industrial companies at that time. Since 1928, the index began to be calculated for thirty companies, and the number of components and calculation methods have remained unchanged to this day.
The purpose of my work is to study world and domestic stock indices.
To achieve the intended goal, the following tasks are set in the work:
- determine the essence and role of stock indices;
- consider methods for calculating stock indices;
- characterize Russian stock indices;
- analyze the dynamics of leading stock indices in Russia and the USA;
- identify problems and prospects for the development of domestic stock indices.
The goals and objectives set in this work determined the structure of the course work, consisting of an introduction, three chapters, a conclusion and a list of references.
The first chapter will examine the essence, role and objectives of stock indices. Calculation methods by which the values of the indices are determined will also be discussed.
The second chapter contains characteristics of the main Russian and American stock indices. Their dynamics over the past few years will also be given, and the index values will be analyzed based on these data.
The third chapter will examine the problems and prospects for the development of Russian stock indices.
The information base of the work mainly consisted of materials from domestic and foreign periodicals and Internet resources, since the topic of stock indices is quite dynamic due to the constantly changing situation in global and regional financial markets and the continuous expansion of the scope of their application.
Asia
The most important Japanese index, as we noted above, is the Nikkei. It is characterized by a fairly large number of shares - 225, which rotate on the Tokyo Stock Exchange. It is noteworthy that the formula for calculating the Nikkei index is almost the same as that used in the American Dow Jones. Another well-known indicator of the Japanese market is Topix. It takes into account information on securities that trade in the first section of the Tokyo Stock Exchange. Other major Asian indicators include the Hang Seng, registered in Hong Kong. It is based on the stock prices of the 33 largest companies that trade on the local stock exchange. Reflects data on approximately 70% of the turnover of the relevant trades.
Significance of indices: national economy
Stock indices have practical significance in a large number of aspects. The largest indicators of the corresponding type, for example, from the same RTS platform, can speak about the state of the national economy. Simply because, as a rule, assets of enterprises of the same country are traded on exchanges that are registered in any state. In the case of RTS - Russia. Regarding Dow Jones - USA, Nikkei - Japan, etc. If stock indices fall sharply, it means that things are not going well in the economy of the country where the trading floor is located. Now the Russian economy is not in the best condition. And this can be traced by analyzing the RTS stock indices. Over the past year, the assets of most companies have fallen in price by tens of percent. At the same time, there is no direct relationship between stock market indices and, say, a country’s GDP. Although a very large drop in the relevant indicators, as a rule, is an indicator of a crisis in the state’s economy, and this, in turn, may well coincide with a decline in GDP.
Indexes in trading
Another area of practical application of indices is stock trading. This is an entire industry that employs people who trade on a professional basis the very same assets that are traded on the RTS, Dow Jones and other exchanges. Their goal is to buy assets and resell them at a higher price. Or, having reserved a so-called short position through exchange instruments, “sell” them at a higher price in order to “buy” them cheaper after a while and thereby make a profit, which the trading platform will pay. Traders study stock indices and their characteristics in detail, and study the factors influencing the dynamics of changes in the values of the corresponding indicators.
How else to make money on the index: we work with ETFs
For private investors, investing directly in indexes is not a realistic option, since they include many companies whose shares can be expensive.
To use the conditional S&P500, you will need to buy shares of all companies in the appropriate proportion, this requires millions of dollars. In order to use indices without the need for such huge investments, the ETF (Exchange Traded Funds) tool was created. In essence, these are foreign exchange-traded investment funds, which represent a portfolio of shares or other assets that completely replicate the composition of the target index. For example, an ETF with the ticker SPY reflects the performance of stocks in the S&P500 index. Shares of the ETFs themselves are also traded on the exchange.
ETF SPY chart
The main advantage of working with ETFs is simplicity. They are traded like ordinary shares; a regular brokerage account is suitable for their purchase, which can be opened online through State Services; their use does not require significant initial investments. The investor has a complete understanding of what securities are included in the ETF - to do this, just look at the index on which this financial instrument is based.
ETF trading for RTS and Eurobond indices has been taking place on the Moscow Exchange stock market since the spring of 2022. These and other ETFs can be used by ITI Capital clients to implement investment strategies.
Trading on MICEX
The MICEX index includes highly liquid shares of about 30 largest companies in the Russian Federation. The corresponding indicator is calculated as the ratio of the total capitalization of securities traded on the site to the indicator on the starting date, simultaneously multiplied by the index value at the same moment.
The peculiarity of calculating the indicator on the MICEX is that it is calculated in rubles. The main MICEX index is supplemented by the so-called composite index - MICEX 10, as well as a number of industry indicators - oil and gas, mechanical engineering, finance, etc. In addition, on the corresponding exchange there are so-called capitalization indices - high, standard and basic.
Calculation of index returns for one period.
The price return of a stock index can be calculated in two ways: either as a percentage change in the value of the price index, or as a weighted average of the returns of the constituent securities of the index.
The price return of the index can be represented as follows:
\( \large \dst \PR_I = { V_{\pRI1} - V_{\pRI0} \over V_{\pRI0} } \) (Formula 2)
Where
- \( \PR_I \) = price return of the index portfolio (as a decimal number, i.e. 12% as 0.12)
- \( V_{\pRI1} \) = value of the price index at the end of the period,
- \( V_{\pRI0} \) = value of the price index at the beginning of the period.
Similarly, the price return of each constituent security can be expressed as:
\( \large \dst \PR_i = { P_{i1} - P_{i0} \over P_{i0} } \) (Formula 3)
Where
- \( \PR_i \) = price return of the security component \(i\) (as a decimal number),
- \( P_{i1} \) = price of the component security \(i\) at the end of the period,
- \( P_{i0} \) = price of the component security \(i\) at the beginning of the period.
Since the index price return is equal to the weighted average price return of the individual securities, we can formulate it as:
\( \large \dst \PR_I = \sum^N_{i=1} w_i \PR_i = \sum^N_{i=1} w_i \left( { P_{i1} — P_{i0} \over P_{i0 } } \right) \) (Formula 4)
Where
- \( \PR_I \) = price return of the index portfolio (as a decimal number),
- \( \PR_i \) = price return of the security component \(i\) (as a decimal number),
- \( N \) = number of individual securities in the index,
- \( w_i \) = security weight \(i\) (the share of the index portfolio attributable to security \(i\)),
- \( P_{i1} \) = price of the component security \(i\) at the end of the period,
- \( P_{i0} \) = price of the component security \(i\) at the beginning of the period.
Formula 4 can be presented in a simpler form:
\( \large \dst \PR_I = w_1 \PR_1 + w_2 \PR_2 + \ldots + w_N \PR_N \) (Formula 5)
Where
- \( \PR_I \) = price return of the index portfolio (as a decimal number),
- \( \PR_i \) = price return of the security component \(i\) (as a decimal number),
- \( w_i \) = security weight \(i\) (the share of the index portfolio attributable to security \(i\)),
- \( N \) = number of individual securities in the index.
Total return includes price yield, interest, dividends and other income distributions.
Thus, the total or total return of the index (eng. 'total return') reflects the price or change in the value of the price index, plus income (dividends and/or interest) for the period, expressed as a percentage of the value of the price index at the beginning of the period.
The total return of the index can be expressed as:
\( \large \dst \TR_I = { V_{\pRI1} - V_{\pRI0} + \Inc_I \over V_{\pRI0} } \) (Formula 6)
Where
- \( \TR_I \) = total return of the index portfolio (as a decimal number),
- \( V_{\pRI1} \) = value of the price index at the end of the period,
- \( V_{\pRI0} \) = value of the price index at the beginning of the period,
- \( \Inc_{i} \) = total income (dividends and/or interest) from all securities in the index, for the period.
The total return of an index can also be calculated as a weighted average of the total returns of the constituent securities. The total return of each component security in the index is calculated as:
\( \large \dst \TR_i = { P_{1i} - P_{0i} + \Inc_i \over P_{0i} } \) (Formula 7)
Where
- \( \TR_i \) = total return of the security component \(i\) (as a decimal number),
- \( P_{1i} \) = price of the component security \(i\) at the end of the period,
- \( P_{0i} \) = price of the component security \(i\) at the beginning of the period.
- \( \Inc_{i} \) = total income (dividends and/or interest) of the security component \(i\) for the period.
Since the total return of an index can be calculated as a weighted average of the total returns of the constituent securities, we can express it as:
\( \large \dst \TR_I = \sum^N_{i=1} w_i \TR_i = \sum^N_{i=1} w_i \left( { P_{1i} — P_{0i} + \Inc_i \over P_{0i} } \right) \) (Formula
Formula 8 can be simplified to the following form:
\( \large \dst \TR_I = w_1 \TR_1 + w_2 \TR_2 + \ldots + w_N \TR_N \) (Formula 9)
Where
- \( \TR_I \) = price return of the index portfolio (as a decimal number),
- \( \TR_i \) = price return of the security component \(i\) (as a decimal number),
- \( w_i \) = security weight \(i\) (the share of the index portfolio attributable to security \(i\)),
- \( N \) = number of securities in the index.