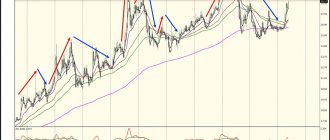
Price today: 43 754.1250 USD +371.6700
- Recalculate:
- in dollars
- in rubles
- In Euro
- in hryvnia
- in tenge
Recalculation is carried out at the cross rate of the Central Bank of the Russian Federation as of January 13, 2022.
Exchange price
On January 12 at 23:00, the price of Bitcoin on the exchange averaged 43,736.3100 USD.
Exchange statistics are updated every hour. On weekends, holidays and at night, the exchange, of course, does not work.
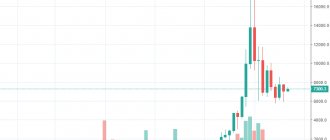
Show price fluctuation graph for 24 hours
Show statistics
:
- for the last
- year
- month
- a week
- for 2022
- in 3 years
- during all this time
Average prices table
- by month
- by days
- on years
| Month | Price, USD |
| January 2022 | 43 382.455 |
| December 2021 | 48 802.47 |
| November 2021 | 60 940.55 |
| October 2021 | 59 887.82000000001 |
| September 2021 | 45 765.7625 |
| August 2021 | 46 075.585 |
| July 2021 | 33 659.42 |
| June 2021 | 35 756.145 |
| May 2021 | 46 863.76 |
| April 2021 | 57 270.72 |
| March 2021 | 55 298.89 |
| February 2021 | 46 972.322499999995 |
| January 2021 | 34 287.41 |
| date | Price, USD |
| 13.01.2022 | 43 754.125 |
| 12.01.2022 | 43 382.455 |
| 11.01.2022 | 42 200.884999999995 |
| 10.01.2022 | 40 959.335 |
| 09.01.2022 | 42 018.895000000004 |
| 08.01.2022 | 41 420.57 |
| 07.01.2022 | 41 944.604999999996 |
| 06.01.2022 | 43 123.995 |
| 05.01.2022 | 44 789.020000000004 |
| 04.01.2022 | 46 558.69500000001 |
| 03.01.2022 | 46 639.89 |
| 02.01.2022 | 47 322.72 |
| 01.01.2022 | 47 073.16 |
| 31.12.2021 | 47 119.33 |
| 30.12.2021 | 46 941.085 |
| 29.12.2021 | 47 126.565 |
| 28.12.2021 | 49 018.155 |
| 27.12.2021 | 51 280.36 |
| 26.12.2021 | 50 384.66 |
| 25.12.2021 | 50 679.06 |
| 24.12.2021 | 51 156.46 |
| 23.12.2021 | 49 722.565 |
| 22.12.2021 | 49 020.92 |
| 21.12.2021 | 47 997.96 |
| 20.12.2021 | 46 541.104999999996 |
| 19.12.2021 | 47 372.975000000006 |
| 18.12.2021 | 46 439.795 |
| 17.12.2021 | 46 754.695 |
| 16.12.2021 | 48 498.775 |
| 15.12.2021 | 48 031.005000000005 |
| 14.12.2021 | 47 493.015 |
| 13.12.2021 | 48 007.97 |
| 12.12.2021 | 49 748.5 |
| 11.12.2021 | 48 166.96 |
| 10.12.2021 | 48 518.634999999995 |
| 09.12.2021 | 49 088.57000000001 |
| 08.12.2021 | 49 963.725 |
| 07.12.2021 | 51 018.3 |
| 06.12.2021 | 49 123.11 |
| 05.12.2021 | 48 802.47 |
| 04.12.2021 | 48 717.134999999995 |
| 03.12.2021 | 55 066.19 |
| 02.12.2021 | 56 629.94 |
| 01.12.2021 | 57 801.259999999995 |
| 30.11.2021 | 57 578.83 |
| 29.11.2021 | 57 825.47 |
| 28.11.2021 | 55 455.655 |
| 27.11.2021 | 54 492.8 |
| 26.11.2021 | 56 388.744999999995 |
| 25.11.2021 | 58 246.84 |
| 24.11.2021 | 56 820.11 |
| 23.11.2021 | 56 679.67999999999 |
| 22.11.2021 | 57 532.495 |
| 21.11.2021 | 59 317.125 |
| 20.11.2021 | 58 676.265 |
| 19.11.2021 | 57 029.475 |
| 18.11.2021 | 58 749.990000000005 |
| 17.11.2021 | 59 701.57 |
| 16.11.2021 | 61 180.119999999995 |
| 15.11.2021 | 64 889.0 |
| 14.11.2021 | 64 562.695 |
| 13.11.2021 | 64 187.16 |
| 12.11.2021 | 63 890.509999999995 |
| 11.11.2021 | 64 858.024999999994 |
| 10.11.2021 | 66 087.445 |
| 09.11.2021 | 67 413.34 |
| 08.11.2021 | 65 529.12 |
| 07.11.2021 | 62 358.065 |
| 06.11.2021 | 60 862.505000000005 |
| 05.11.2021 | 61 705.565 |
| 04.11.2021 | 61 924.35 |
| 03.11.2021 | 62 305.705 |
| 02.11.2021 | 62 480.525 |
| 01.11.2021 | 61 018.595 |
| 31.10.2021 | 61 221.315 |
| 30.10.2021 | 61 572.95 |
| 29.10.2021 | 61 618.71 |
| 28.10.2021 | 60 198.755000000005 |
| 27.10.2021 | 59 800.59 |
| 26.10.2021 | 61 579.36 |
| 25.10.2021 | 62 184.16 |
| 24.10.2021 | 60 505.295 |
| 23.10.2021 | 60 719.270000000004 |
| 22.10.2021 | 61 874.2 |
| 21.10.2021 | 64 360.945 |
| 20.10.2021 | 65 262.18 |
| 19.10.2021 | 62 939.405 |
| 18.10.2021 | 61 294.325 |
| 17.10.2021 | 60 374.2 |
| 16.10.2021 | 61 247.625 |
| 15.10.2021 | 59 887.82000000001 |
| 14.10.2021 | 57 684.57 |
| 13.10.2021 | 56 024.295 |
| 12.10.2021 | 55 872.575 |
| 11.10.2021 | 56 137.33 |
| 10.10.2021 | 55 302.575 |
| 09.10.2021 | 54 590.759999999995 |
| 08.10.2021 | 54 857.0 |
| 07.10.2021 | 54 375.85 |
| 06.10.2021 | 53 047.994999999995 |
| 05.10.2021 | 50 486.375 |
| 04.10.2021 | 48 222.744999999995 |
| 03.10.2021 | 48 161.205 |
| 02.10.2021 | 47 908.09 |
| 01.10.2021 | 45 887.475 |
| 30.09.2021 | 42 771.695 |
| 29.09.2021 | 41 696.925 |
| 28.09.2021 | 41 852.685 |
| 27.09.2021 | 43 249.825 |
| 26.09.2021 | 42 376.945 |
| 25.09.2021 | 42 351.51 |
| 24.09.2021 | 42 975.19 |
| 23.09.2021 | 44 051.295 |
| 22.09.2021 | 42 300.645000000004 |
| 21.09.2021 | 41 696.55 |
| 20.09.2021 | 44 946.56 |
| 19.09.2021 | 47 620.4 |
| 18.09.2021 | 47 937.235 |
| 17.09.2021 | 47 471.335 |
| 16.09.2021 | 47 774.53 |
| 15.09.2021 | 47 591.225000000006 |
| 14.09.2021 | 46 019.965 |
| 13.09.2021 | 45 166.57 |
| 12.09.2021 | 45 584.66 |
| 11.09.2021 | 45 364.805 |
| 10.09.2021 | 45 612.47 |
| 09.09.2021 | 46 453.795 |
| 08.09.2021 | 45 919.055 |
| 07.09.2021 | 48 411.83 |
| 06.09.2021 | 51 900.92 |
| 05.09.2021 | 50 694.729999999996 |
| 04.09.2021 | 50 025.235 |
| 03.09.2021 | 49 709.354999999996 |
| 02.09.2021 | 49 503.795 |
| 01.09.2021 | 47 803.395000000004 |
| 31.08.2021 | 47 483.229999999996 |
| 30.08.2021 | 47 875.29 |
| 29.08.2021 | 48 747.49 |
| 28.08.2021 | 48 846.685 |
| 27.08.2021 | 47 771.56 |
| 26.08.2021 | 47 907.44 |
| 25.08.2021 | 48 196.405 |
| 24.08.2021 | 48 720.315 |
| 23.08.2021 | 49 781.04 |
| 22.08.2021 | 48 816.08500000001 |
| 21.08.2021 | 49 069.925 |
| 20.08.2021 | 48 014.75 |
| 19.08.2021 | 45 513.134999999995 |
| 18.08.2021 | 45 132.935 |
| 17.08.2021 | 45 769.880000000005 |
| Data is provided for the dates on which the auction took place. Therefore, there is no data for weekends and holidays. | |
| The table is too large to display on the screen. | |
| Year | Price, USD |
| 2022 | 43 382.455 |
| 2021 | 47 908.09 |
| 2020 | 9 701.64 |
| 2019 | 7 783.71 |
| 2018 | 6 945.665 |
| 2017 | 2 576.355 |
| 2016 | 581.2925 |
| 2015 | 248.315 |
| 2014 | 492.075 |
| 2013 | 115.455 |
| 2012 | 6.69 |
| 2011 | 3.3 |
| 2010 | 0.0 |
| 2009 | 0.0 |
Bitcoin rate forecast 2022, 2023-2025
Bitcoin price forecast for March 2024 . The exchange rate at the beginning of the month was $95,413. The maximum rate is $97,577, the minimum is $84,809. The average rate for the month is $92,248. Bitcoin price forecast at the end of the month $91,193, change for March -4.4%.
Bitcoin rate forecast for April 2024 . The rate at the beginning of the month was $91,193. The maximum rate is $91,193, the minimum is $71,240. The average rate for the month is $82,557. Bitcoin price forecast at the end of the month $76602, change for April -16.0%.
Bitcoin price forecast for May 2024 . The exchange rate at the beginning of the month was $76,602. The maximum rate is $90,291, the minimum is $76,602. The average rate for the month is $81,970. Bitcoin price forecast at the end of the month $84384, change for May 10.2%.
Bitcoin rate forecast for June 2024 . The exchange rate at the beginning of the month was $84,384. The maximum rate is $84,384, the minimum is $67,797. The average rate for the month is $77,366. Bitcoin price forecast at the end of the month $72900, change for June -13.6%.
Bitcoin price forecast for July 2024 . The exchange rate at the beginning of the month was $72,900. The maximum rate is $74,424, the minimum is $64,686. The average rate for the month is $70,391. Bitcoin price forecast at the end of the month $69,555, change for July -4.6%.
Bitcoin rate forecast for August 2024 . The rate at the beginning of the month was $69,555. The maximum rate is $69,728, the minimum is $60,604. The average rate for the month is $66,263. Bitcoin price forecast at the end of the month $65,166, change for August -6.3%.
Bitcoin price forecast for September 2024 . The exchange rate at the beginning of the month was $65,166. The maximum rate is $80,885, the minimum is $65,166. The average rate for the month is $71,703. Bitcoin price forecast at the end of the month $75593, change for September 16.0%.
Bitcoin rate forecast for October 2024 . The rate at the beginning of the month was $75,593. The maximum rate is $93,826, the minimum is $75,593. The average rate for the month is $83,175. Bitcoin price forecast at the end of the month $87688, change for October 16.0%.
Bitcoin price forecast for November 2024 . The rate at the beginning of the month was $87,688. The maximum rate is $100,837, the minimum is $87,643. The average rate for the month is $92,602. Bitcoin price forecast at the end of the month $94240, change for November 7.5%.
Bitcoin rate forecast for December 2024 . The exchange rate at the beginning of the month was $94,240. The maximum rate is $112,399, the minimum is $94,240. The average rate for the month is $101,481. Bitcoin price forecast at the end of the month $105046, change for December 11.5%.
Bitcoin price forecast for January 2025 . The exchange rate at the beginning of the month was $105,046. The maximum rate is $105,046, the minimum is $89,408. The average rate for the month is $98,910. Bitcoin price forecast at the end of the month is $96,138, change for January -8.5%.
Bitcoin rate forecast for February 2025 . The exchange rate at the beginning of the month was $96,138. The maximum rate is $96,138, the minimum is $83,509. The average rate for the month is $91,395. Bitcoin price forecast at the end of the month $89,795, change for February -6.6%.
Bitcoin price forecast for March 2025 . The rate at the beginning of the month is $89,795. The maximum rate is $89,795, the minimum is $70,148. The average rate for the month is $81,292. Bitcoin price forecast at the end of the month $75428, change for March -16.0%.
Bitcoin price forecast for April 2025 . The exchange rate at the beginning of the month was $75,428. The maximum rate is $77,283, the minimum is $67,171. The average rate for the month is $73,027. Bitcoin price forecast at the end of the month $72227, change for April -4.2%.
Bitcoin price forecast for May 2025 . The rate at the beginning of the month was $72,227. The maximum rate is $72,848, the minimum is $63,316. The average rate for the month is $69,118. Bitcoin price forecast at the end of the month $68082, change for May -5.7%.
Bitcoin rate forecast for June 2025 . The exchange rate at the beginning of the month was $68,082. The maximum rate is $68,082, the minimum is $57,519. The average rate for the month is $63,883. Bitcoin price forecast at the end of the month $61,848, change for June -9.2%.
Bitcoin price forecast for July 2025 . The exchange rate at the beginning of the month was $61,848. The maximum rate is $76,766, the minimum is $61,848. The average rate for the month is $68,052. Bitcoin price forecast at the end of the month $71,744, change for July 16.0%.
Bitcoin price forecast for August 2025 . The exchange rate at the beginning of the month was $71,744. The maximum rate is $71,744, the minimum is $56,794. The average rate for the month is $65,338. Bitcoin price forecast at the end of the month $61069, change for August -14.9%.
Bitcoin price forecast for September 2025 . The rate at the beginning of the month was $61,069. The maximum rate is $61,069, the minimum is $47,707. The average rate for the month is $55286. Bitcoin price forecast at the end of the month $51298, change for September -16.0%.
Bitcoin rate forecast for October 2025 . The rate at the beginning of the month was $51,298. The maximum rate is $63,671, the minimum is $51,298. The average rate for the month is $56,443. Bitcoin price forecast at the end of the month $59,506, change for October 16.0%.
Bitcoin price forecast for November 2025 . The exchange rate at the beginning of the month was $59,506. The maximum rate is $59,506, the minimum is $46,486. The average rate for the month is $53,871. Bitcoin price forecast at the end of the month $49,985, change for November -16.0%.
Bitcoin rate forecast for December 2025 . The rate at the beginning of the month was $49,985. The maximum rate is $54,538, the minimum is $47,402. The average rate for the month is $50,724. Bitcoin price forecast at the end of the month $50,970, change for December 2.0%.
Bitcoin price forecast for January 2026 . The exchange rate at the beginning of the month was $50,970. The maximum rate is $50,970, the minimum is $39,818. The average rate for the month is $46,143. Bitcoin price forecast at the end of the month $42815, change for January -16.0%.
Bitcoin rate forecast for February 2026 . The exchange rate at the beginning of the month was $42,815. The maximum rate is $53,142, the minimum is $42,815. The average rate for the month is $47,109. Bitcoin price forecast at the end of the month $49,665, change for February 16.0%.
Record liquidations in 2022
The cascading liquidation of long Bitcoin futures positions sent the currency to a low around $42,000. On-chain analyst @TXMCtrades shared with his readers a chart that reflects the 1-day change in open interest for the entire 2021.
Source: Twitter
As we can see, as a result of the events of December 4, traders’ losses amounted to 58,202 BTC. A higher intraday figure was recorded this year only on May 19th. The flash crash then forced traders to liquidate positions worth 79,244 BTC.
Analysis of another Bitcoin futures chart allows you to see the scale of changes in open interest in the period from December 3 to 4. The massive liquidation of positions caused traders' total positions to collapse by a staggering $4.3 billion in just one day. The size of the drawdown from $20.9 billion to $16.6 billion was 20.5%.
Open interest in Bitcoin futures. Source: Glassnode
The latest shake-up for BTC?
Few expected such movements. This fall, some analysts predicted the BTC rate to rise to $98,000, and the market sentiment for the currency was frankly bullish. It was also supported by historical statistics, according to which November and December have traditionally been bullish months.
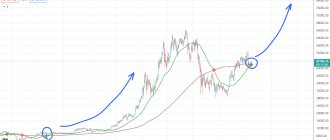
Despite the lack of parabolic growth, many were talking about the continuation of the bull market. In particular, this was suggested by theories about the lengthening of BTC cycles and that Bitcoin will reach the maximum of the current cycle only in 2022.
Crypto market analyst @TechDev_52 recently wrote about the same thing on Twitter. He compared the technical aspects of the fractal structure of the current market cycle and the previous two. In all cases, an interesting point that attracts attention is when the market reaches the 1.618 Fib level of the external correction, highlighted by the price move from the peak of the previous bull market to the bottom of the next cycle.
Source: Twitter
In all cases, one can see a protracted multi-month consolidation below the Fibo level of 1.618. In the previous two cycles, this consolidation culminated in a bullish breakout of this resistance and further parabolic growth to new all-time highs. It is curious that the correction always reached the Fib level area of 1.272 external correction. This was followed by an impulsive bullish break of the descending resistance line (yellow dotted line) and confirmation of this break (backtest).
However, the most important point from the point of view of Saturday’s BTC collapse is the white horizontal line observed on all charts. It marks the level of the peak high after the breakout, which in previous cycles was then retested for support. This occurred just before Bitcoin further made a clean break of key 1.618 Fib resistance.


